How to clean HttpCC->httpCRq from memory? #1552
Replies: 12 comments
-
|
Posted at 2021-06-06 by @allObjects @geza, with exception of a few things, all you do in the left side of the IDE / Console, you can do on your application code, because all is js and it is executed (see REPL) by the Espruino JS interpreter on your MDBT42Q. I assume you 'cannot do it' because the things you try to throw out is at the times a very part of your application / communication while running / begin connected / having pending requests / responses. I do not expect a memory leak and therefore the HttpCC object (Array?) doe snot keep growing. Looks to me that individual elements come and go and grow and shrink over time. What you may look at is to cleanup received / sent data that is still lingering around even after the communication 'transaction' completed (until the next one is setup and replaces it). May be that with large amounts of data you can apply streaming as described here: https://www.espruino.com/Internet#transferring-large-amounts-of-data |
Beta Was this translation helpful? Give feedback.
-
|
Posted at 2021-06-06 by Robin Sun 2021.06.06
Does running the following command more frequently, both inform and improve on making memory available?
'Run a Garbage Collection pass, and return an object containing information on memory usage' |
Beta Was this translation helpful? Give feedback.
-
|
Posted at 2021-06-06 by Geza @allObjects thank you for your thoughts.
I thought the same, but: The result: WEB Ide's left side:
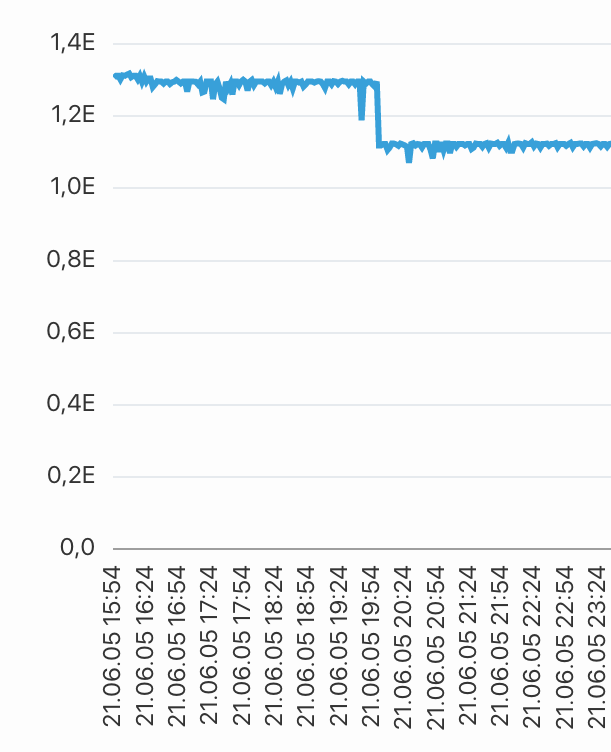
Normally this is indeed the case, but sometimes it is not. I have attached a picture of memory usage. In case the memory decreased, the size of the HttpCC array increased. Attachments: |
Beta Was this translation helpful? Give feedback.
-
|
Posted at 2021-06-06 by Geza @robin yes, I use the process.memory() and in some cases it doesn't help. In those cases, I can only empty the HttpCC array manually. |
Beta Was this translation helpful? Give feedback.
-
|
Posted at 2021-06-07 by @allObjects There is some memory discussion in conversation about Help needed on trace() to locate user var reference and contents. It may shed some light on this |
Beta Was this translation helpful? Give feedback.
-
|
Posted at 2021-06-09 by @gfwilliams
This one may actually be unrelated - as @MaBecker says the code itself should work fine. Are you writing to As a hack, this might fix it: While this shouldn't happen in 2v09, in older firmwares you could get in a state where a function was loaded and referenced Storage, but the contents of storage had moved. If we could reproduce with some simple code then I could try and get a fix in about the actual memory leak... It'd be good to try and track down why this is happening (if there's some really simple code you can share which reproduces the leak?). Usually having a |
Beta Was this translation helpful? Give feedback.
-
|
Posted at 2021-06-10 by @MaBecker This is the conversation about that topic |
Beta Was this translation helpful? Give feedback.
-
|
Posted at 2021-06-10 by Geza @allObjects thanks for the suggestion |
Beta Was this translation helpful? Give feedback.
-
|
Posted at 2021-06-10 by Geza
Yes, i use it for logging
@gfwilliams You think well (as always)..the problem was basically caused by because it was still running when the require("http").get(...) started. It also produced several strange things after a few days... for example memory leak, http socket close error, even the temperature reading became inaccurate. Thanks for all the support! |
Beta Was this translation helpful? Give feedback.
-
|
Posted at 2021-06-10 by @gfwilliams Glad you found the problem! I guess maybe there was some logging to Storage inside your I just had a quick go at reproducing this and it seems I can actually do it pretty easily (even on desktop) with: I have just committed a fix for this so there should be a build ready in the next few minutes. It may actually be that this is the cause of the vast majority of your issues (if code that was stored in flash is no longer being executed correctly) |
Beta Was this translation helpful? Give feedback.
-
|
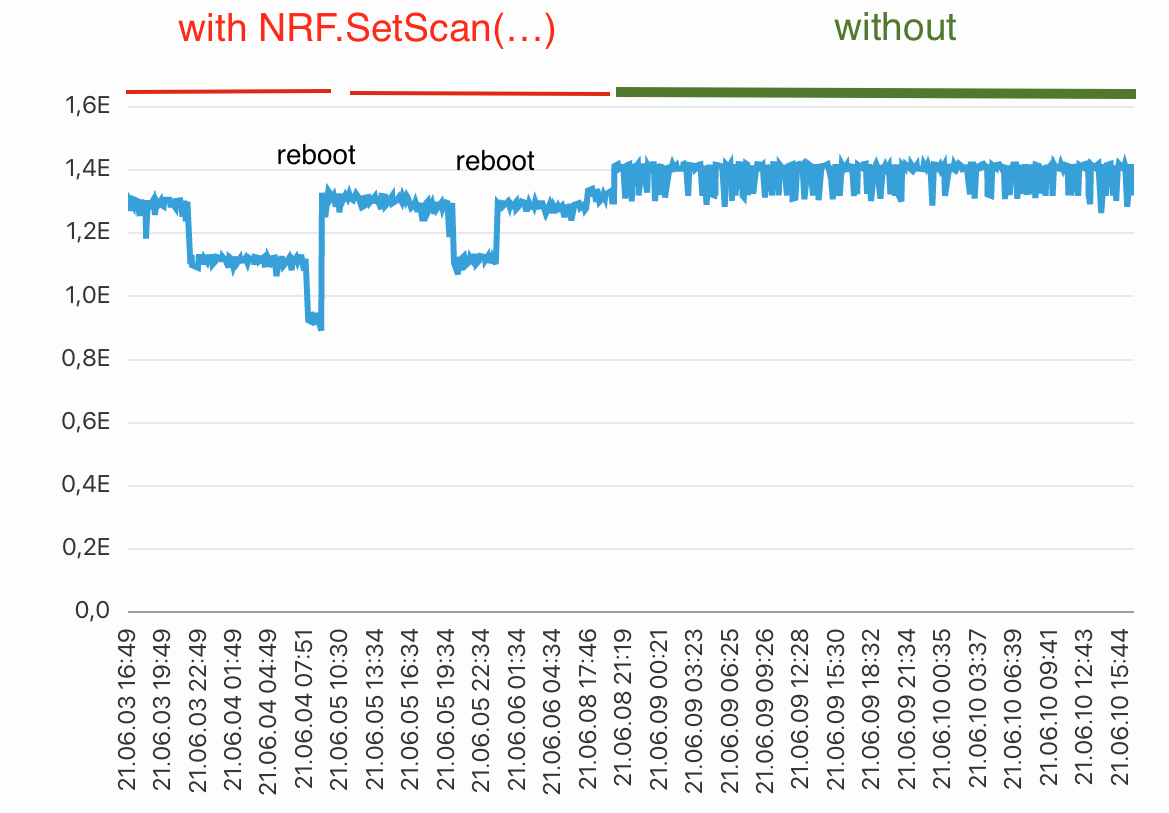
Posted at 2021-06-10 by Geza
I store the result of setScan in an array, but inside the http handler write the log. I log not only the errors but also the exceptions. I'm trying the fix, which is interesting! I attach the memory usage graph. Attachments: |
Beta Was this translation helpful? Give feedback.
-
|
Posted at 2021-06-11 by @allObjects To get you logging out of the request memory scope, you could create a valueObj for the data to log - |
Beta Was this translation helpful? Give feedback.
Uh oh!
There was an error while loading. Please reload this page.
-
Posted at 2021-06-06 by Geza
I use the MDBT42Q (2v09) with the the ESP8266. Sometimes the memory starts to run low.
In this case, the size of HttpCC increased:
if i use the following command in WEB IDE (left side), it will clean the memory:
But i can't use it in js.
How can I achieve the same in my javascript code?
Beta Was this translation helpful? Give feedback.
All reactions