Datadog tags #20
Description
Hello, I would like to kindly ask for a quick feedback on the following.
I see on the following line that we report the queue latency and sizes: https://github.com/phstc/sidekiq-statsd/blob/master/lib/sidekiq/statsd/server_middleware.rb#L66 which ends up in a metric as:
- production.worker.queues.critical.latency
- production.worker.queues.low.latency
- production.worker.queues.default.latency
- ... etc
It's not very clear though from the above how can I mange to group all queues and get the average latency for each one of them. For example in datadog view:
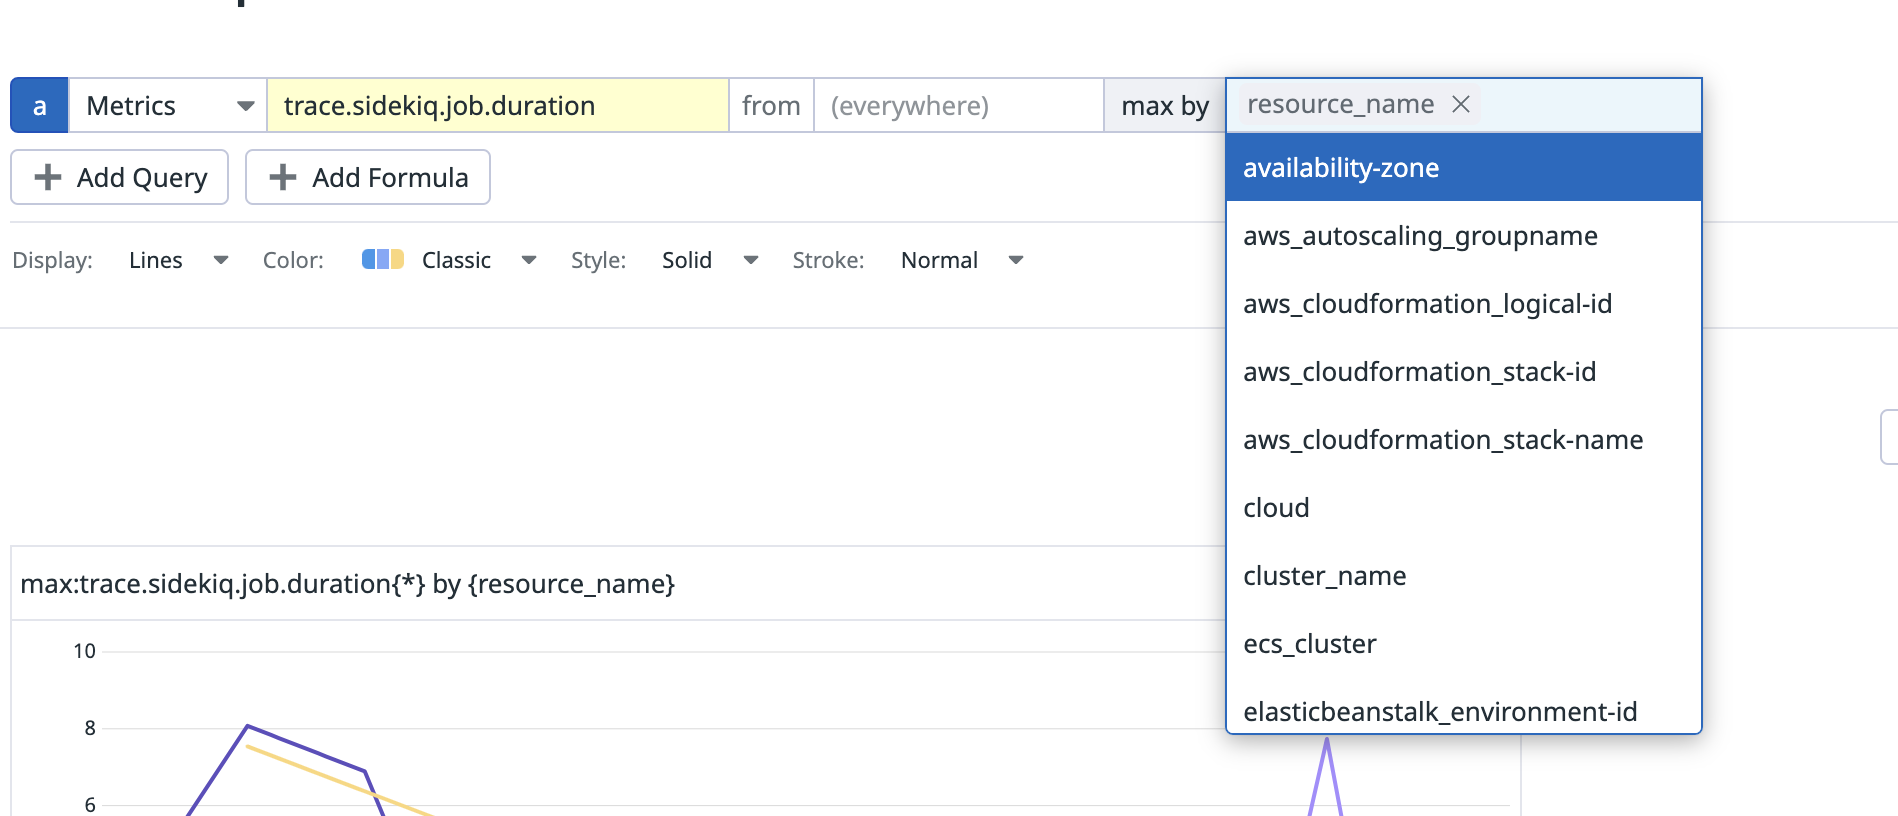
On the other hand if you report the metric with a tag instead:
statsd.gauge 'sidekiq.queue.latency', sidekiq_queue.latency, tags: { queue_name: queue_name }
I can grab the queue name from the dropdown and see all queue latencies (I'm about to validate this as I write this).
I remember in grafana this was slightly different if I'm not mistaken because you can have wildcards in the metric key (correct me if I'm wrong),
Any ideas, thoughts on this?
Thank you in advance.