How can I draw a plot by overlapping it? #2330
-
|
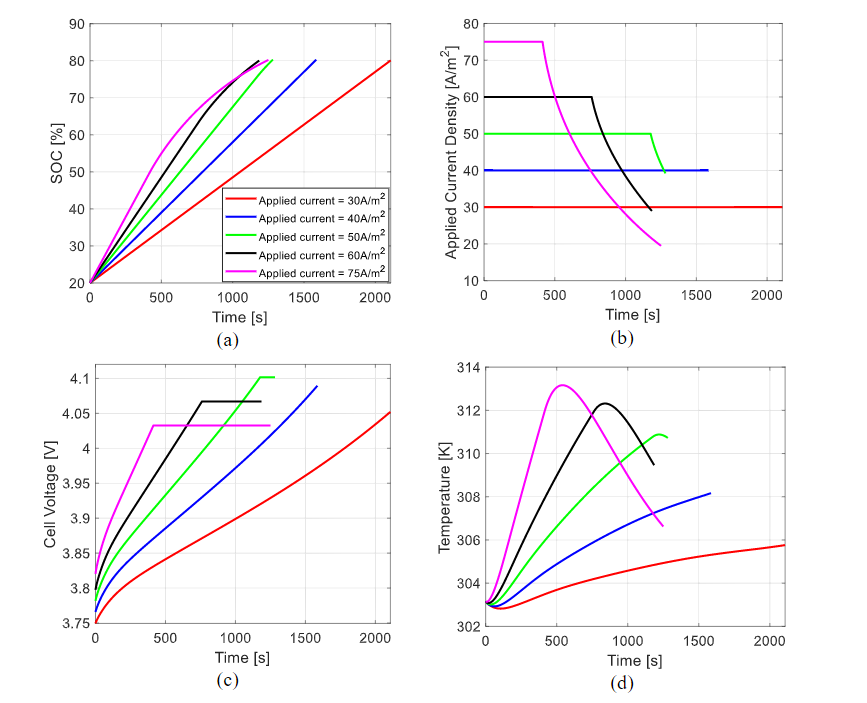
I want to draw a graph like the picture I posted, but how can I do it like sim.plot?
Thank you so much for always helping me. It helps a lot. |

Beta Was this translation helpful? Give feedback.
Replies: 2 comments 1 reply
-
|
You can't do this with plt.plot(sim.solution["Time [s]"].data, sim.solution["Terminal voltage [V]"].data) |
Beta Was this translation helpful? Give feedback.
-
|
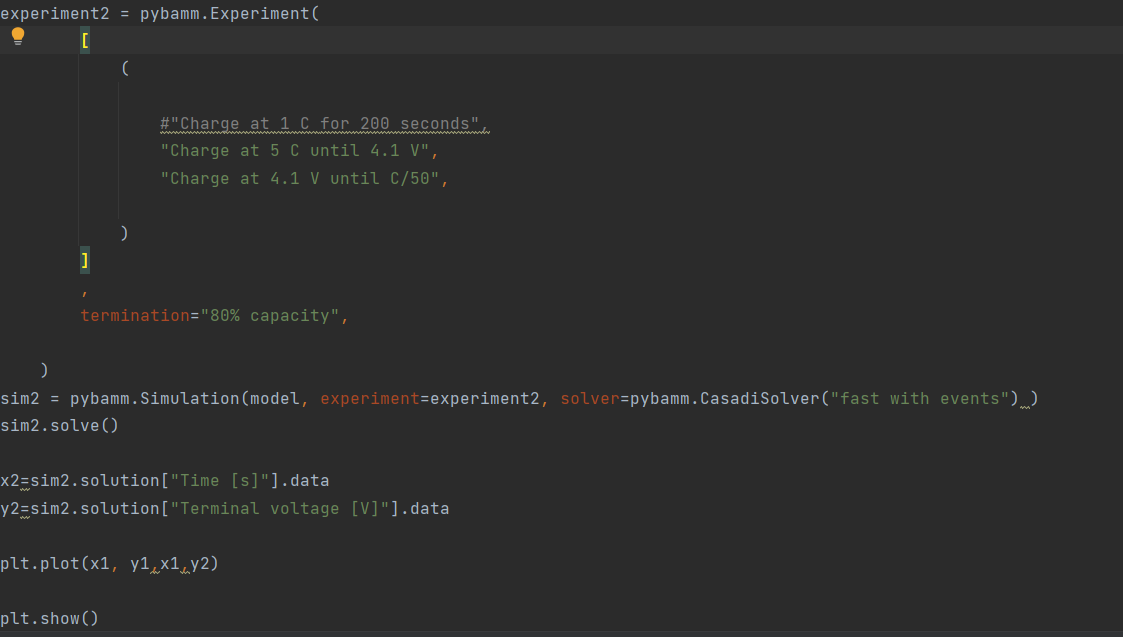
Thank you very much. I made the code like this. However, I couldn't draw a graph of overlapping shapes as I wanted. I'd appreciate it if you could tell me how to fix it. |

Beta Was this translation helpful? Give feedback.
-
|
This becomes a matplotlib question not a pybamm question. They have lots of tutorials available https://matplotlib.org/stable/tutorials/index.html. Maybe someone else will read this and have time to help you |
Beta Was this translation helpful? Give feedback.
You can't do this with
sim.plot. You have to usematplotlibdirectly, for example