Plots look downsampled compared to the original data #2629
-
|
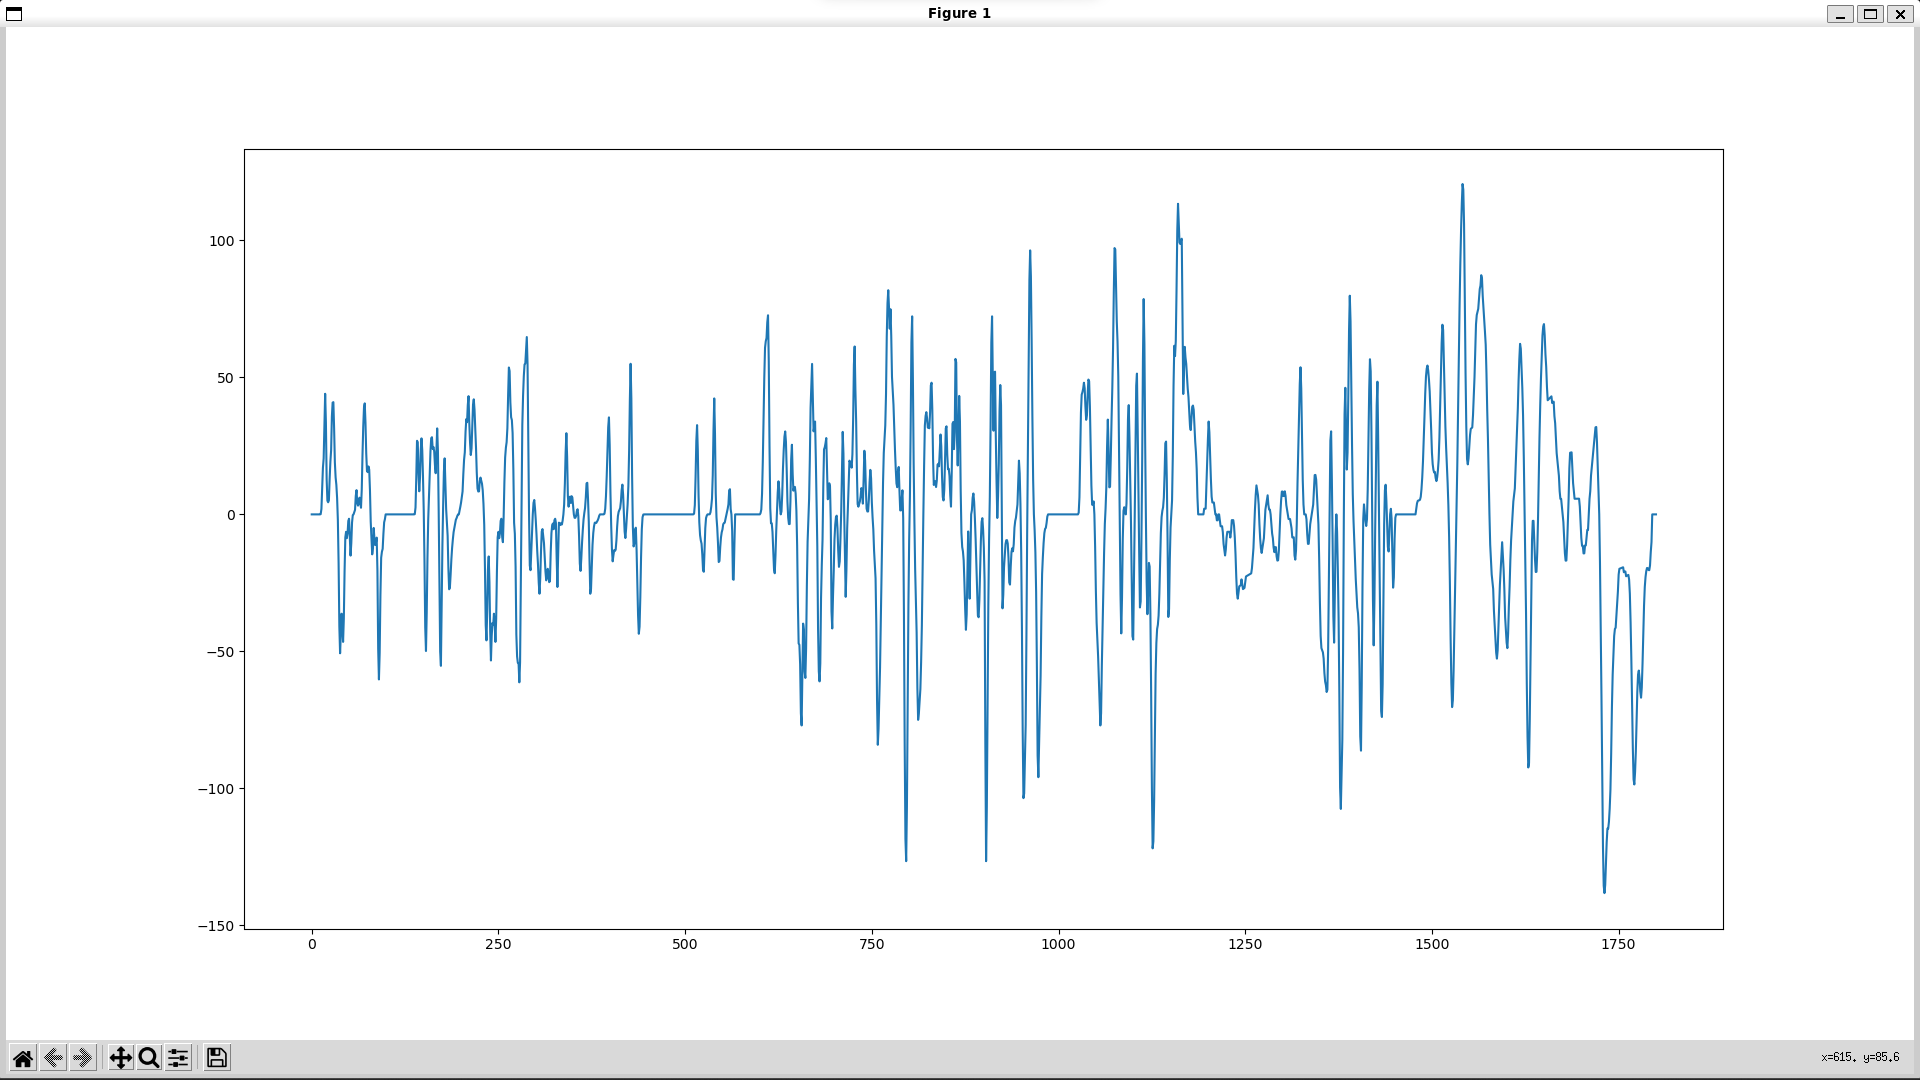
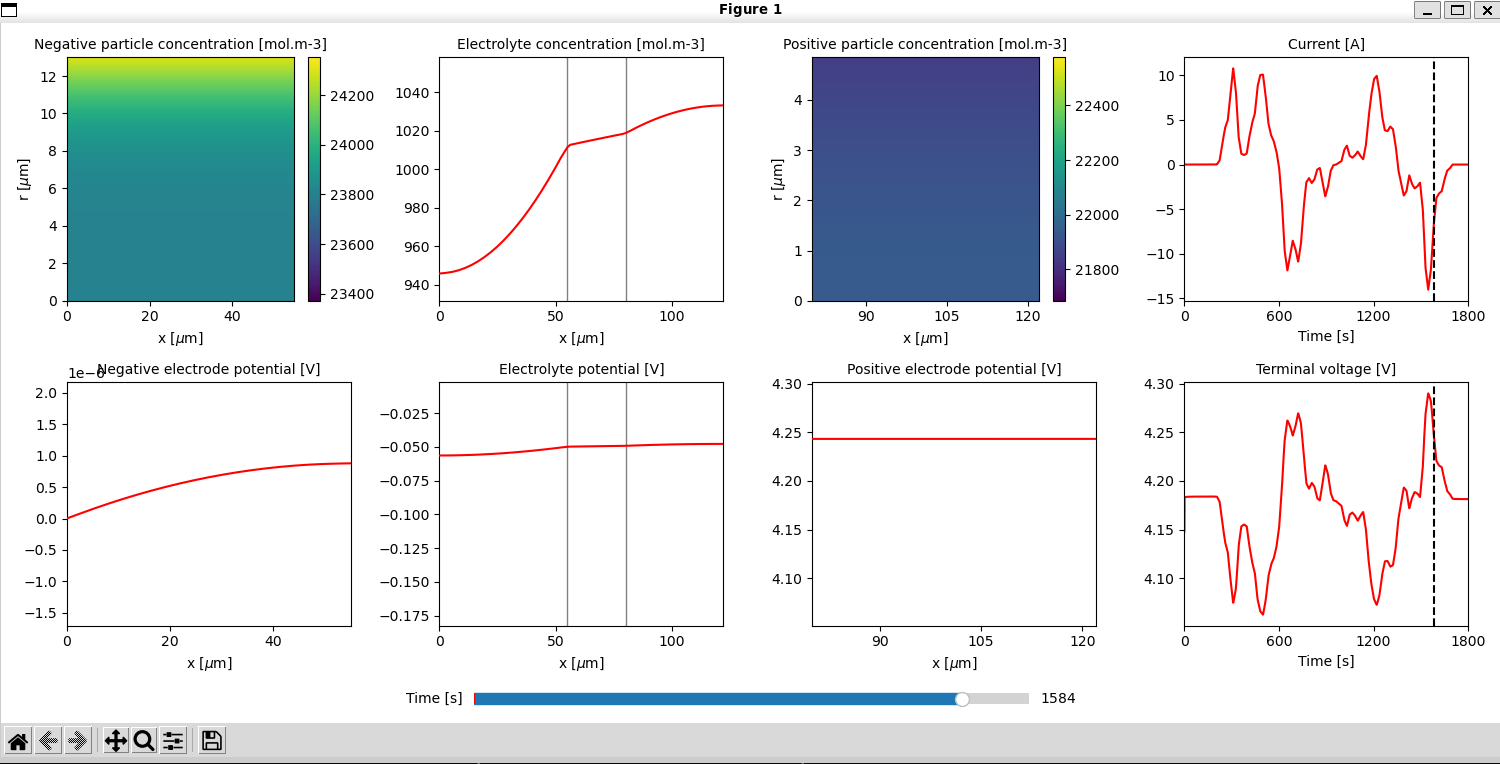
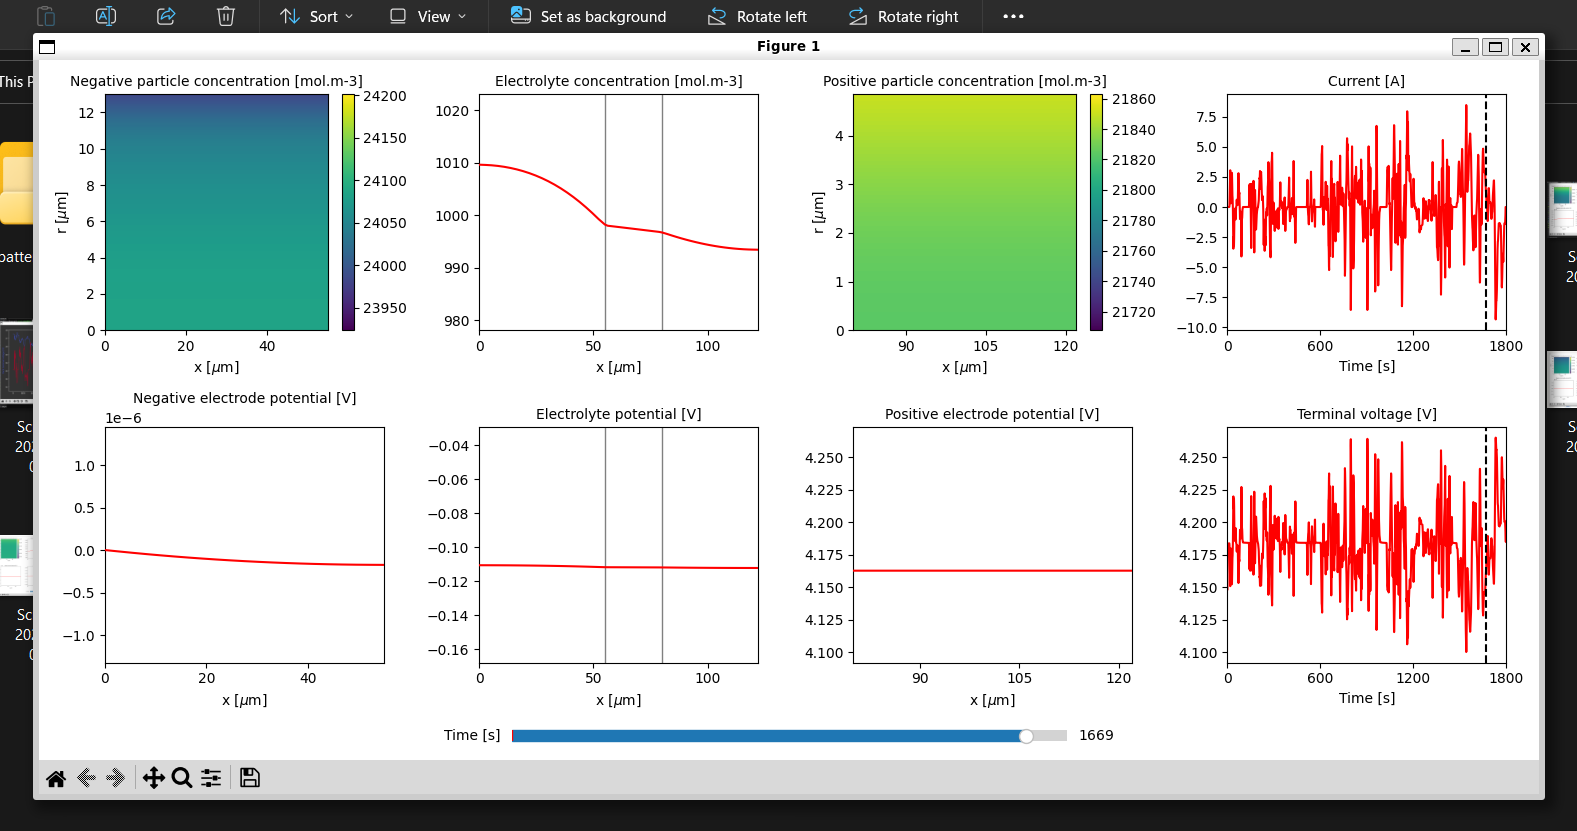
I simulated the WLTC drive cycle (using my own data), with a power function input. The current, voltage and power plots look really smoothed out compared to the original data that I have (also plotted for comparison). What could be the possible reasons? Plots:
You can see that some of the trends in the data are captured, but yeah, not completely accurate. |
Beta Was this translation helpful? Give feedback.
Replies: 2 comments 21 replies
-
|
Power inputs are handled via an algebraic function; that is, an extra equation gets solved for the current that reproduces the requested power input. So you probably just need to increase the temporal resolution of your simulation or lower the absolute or relative tolerances. That way, the current needed to mimic the power input gets computed more accurately. |
Beta Was this translation helpful? Give feedback.
-
|
Sorry about that, I meant "all it takes" in perspective of setting up the power to current conversion using CasADi. I was aware of CasADi solver from our earlier discussion, just wasn't sure how P = V * I was enough information to get current values. So these DAE's are the SPM/DFN/etc. models that we choose right? |
Beta Was this translation helpful? Give feedback.
-
|
The DAEs are the SPM/SPMe/DFN models, yes. P = V * I is enough information because CasADi solves for the current that satisfies P_applied - V * I = 0. In terms of internal equation structure, V is a function of current. So it's not that different from solving for the current that satisfies V_applied - V = 0. |
Beta Was this translation helpful? Give feedback.
-
|
Nice, that makes sense. Thank you, it's been bugging me since forever! |
Beta Was this translation helpful? Give feedback.
-
|
We never wrote a paper on this, but luckily @MarcBerliner did https://iopscience.iop.org/article/10.1149/1945-7111/ac9a80/pdf (he calls it "General Operating Modes") |
Beta Was this translation helpful? Give feedback.
-
|
@tinosulzer I see. That's neat! |
Beta Was this translation helpful? Give feedback.
-
|
Looks like a time scaling issue. How are you defining the interpolant? It should be something like this, but for power: # create interpolant - must be a function of *dimensional* time
timescale = param.evaluate(model.timescale)
current_interpolant = pybamm.Interpolant(drive_cycle[:, 0], drive_cycle[:, 1], timescale * pybamm.t)You won't need to specify the timescale any more once we remove the non-dimensionalization. But for now you do. |
Beta Was this translation helpful? Give feedback.
-
|
Oh no, here's what I got:
|
Beta Was this translation helpful? Give feedback.
-
|
Apparently, all I needed to do was to eliminate the extra columns of data in my drive cycle file! I also had a bit of calculation on that data in the script, I moved it into excel. Then, it simulated well! That's so strange to me.
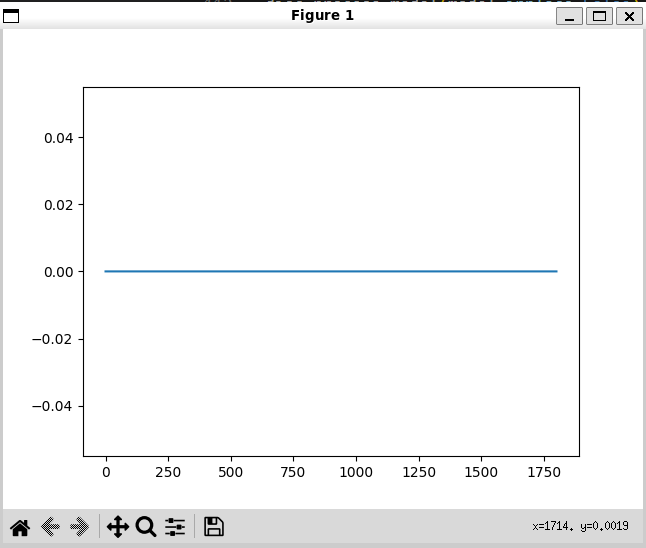
The 'power_interpolant.evaluate(t_eval)' did not get better, though. |
Beta Was this translation helpful? Give feedback.
-
Is my result something to be worried about? It does look like it to me. |
Beta Was this translation helpful? Give feedback.
-
|
Do |
Beta Was this translation helpful? Give feedback.
-
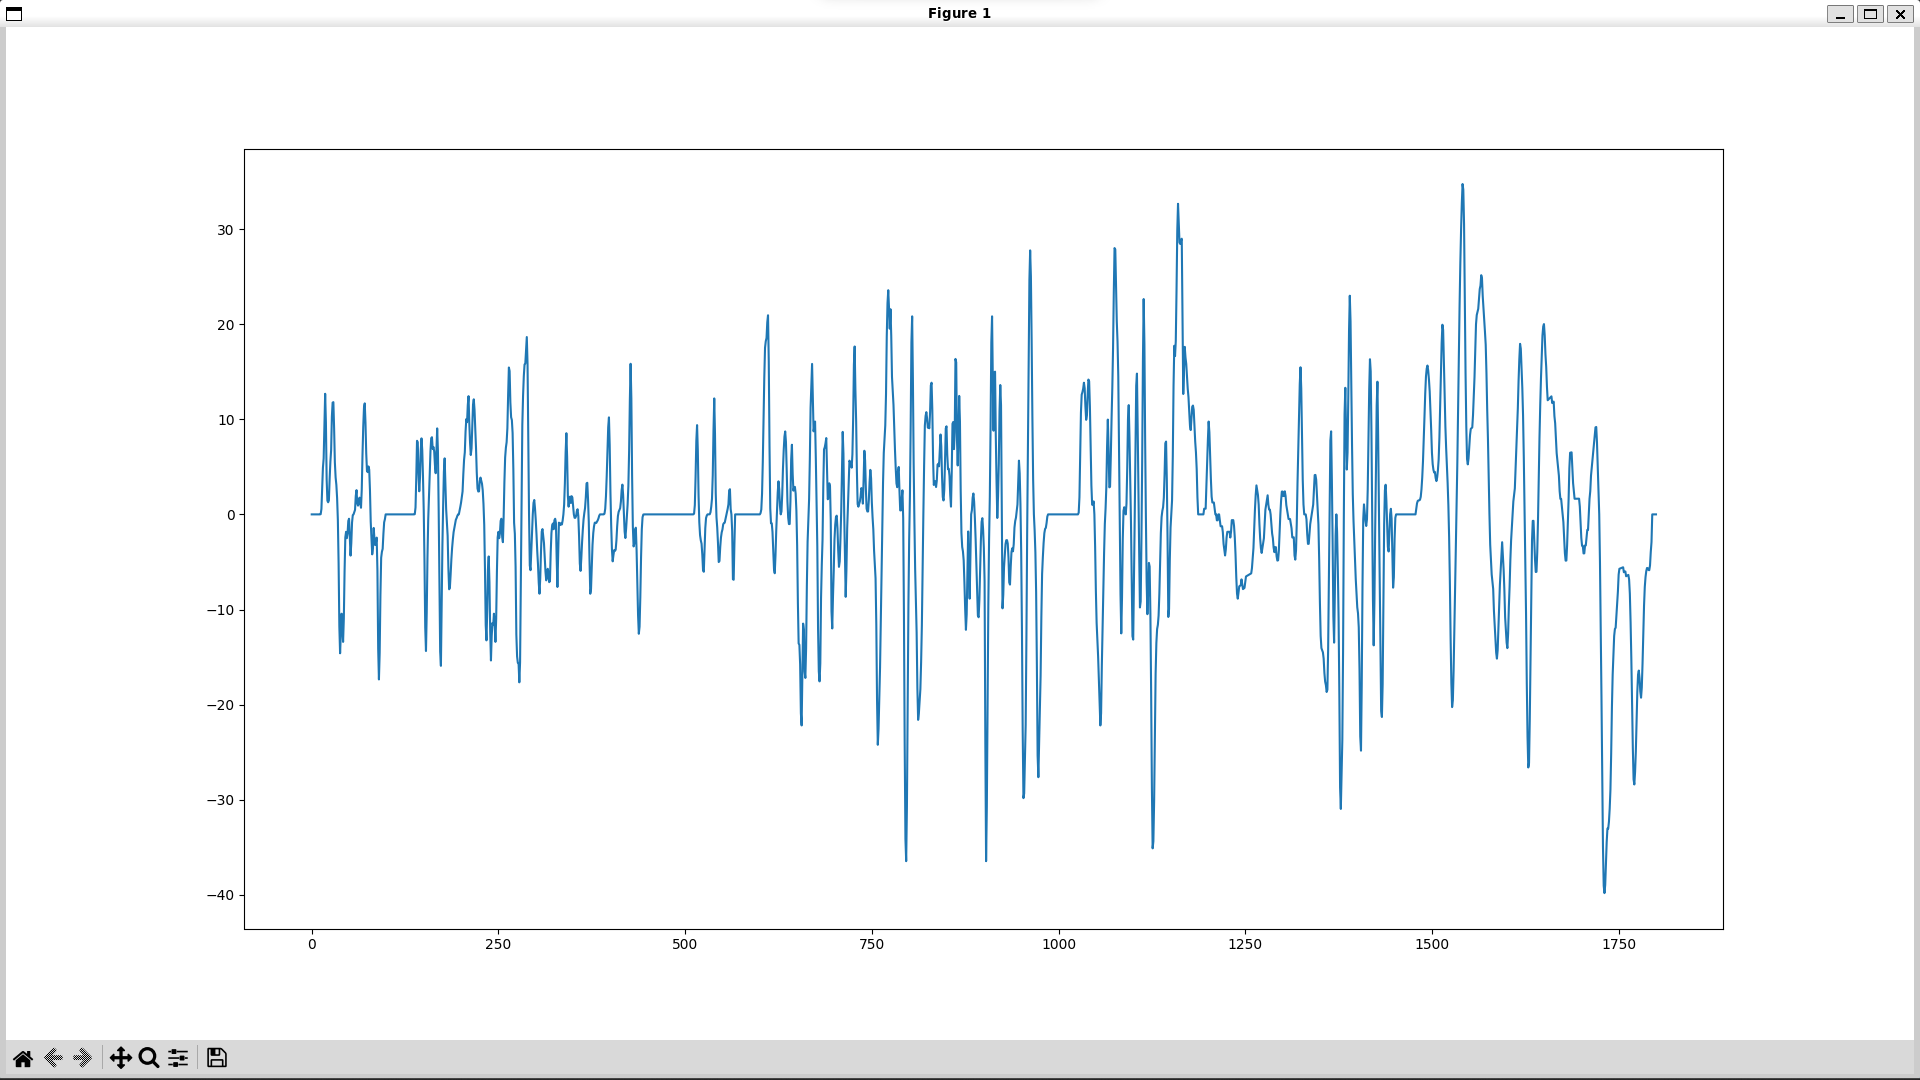
|
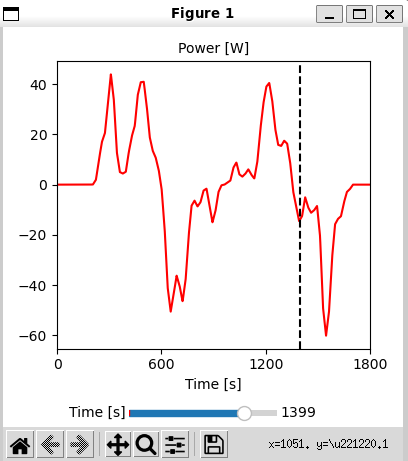
That makes sense. Here, I plotted it: |
Beta Was this translation helpful? Give feedback.
Looks like a time scaling issue. How are you defining the interpolant? It should be something like this, but for power:
You won't need to specify the timescale any more once we remove the non-dimensionalization. But for now you do.