You signed in with another tab or window. Reload to refresh your session.You signed out in another tab or window. Reload to refresh your session.You switched accounts on another tab or window. Reload to refresh your session.Dismiss alert
What if I want to store a particular cycle (e.g., 5th cycle or 64th cycle)? save_at_cycles seems to save every nth cycle, not nth cycle.
I changed the width and height of the electrode to set the capacity of the cell to 1.1 Ah. However, if you look at the discharge voltage curve I made, you can see that the discharge capacity increases beyond 1.1 to 1.6. Why does it appear like this? What should be done to correct this?
I would be very grateful if you could reply. I really hope you do it.
reacted with thumbs up emoji reacted with thumbs down emoji reacted with laugh emoji reacted with hooray emoji reacted with confused emoji reacted with heart emoji reacted with rocket emoji reacted with eyes emoji
Uh oh!
There was an error while loading. Please reload this page.
-
I want to plot discharge voltage curve though pybamm.

So I wrote the code by referring to this(https://github.com/pybamm-team/PyBaMM/blob/main/examples/notebooks/simulating-long-experiments.ipynb).
For example, I want to plot a 100th cycle of discharge voltage curve
import pybamm
import matplotlib.pyplot as plt
import numpy as np
parameter_values = pybamm.ParameterValues("Mohtat2020")
parameter_values.update({"SEI kinetic rate constant [m.s-1]": 1e-14})
parameter_values.update({'Electrode height [m]': 0.605 })
parameter_values.update({'Electrode width [m]' : 0.1035 })
parameter_values.update({'Nominal cell capacity [A.h]' : 1.1 })
parameter_values.update({'Lower voltage cut-off [V]' : 2})
parameter_values.update({'Upper voltage cut-off [V]' : 3.9})
spm = pybamm.lithium_ion.SPMe({"SEI": "ec reaction limited"})
Calculate stoichiometries at 100% SOC
parameter_values.set_initial_stoichiometries(1);
pybamm.set_logging_level("NOTICE")
experiment = pybamm.Experiment([
(f"Discharge at 4C until 2.7V",
"Rest for 1 hour",
f"Charge at 3.6C until 3.6V",
f"Hold at 3.6V until C/50",
] * 100,
termination="20% capacity"
)
sim = pybamm.Simulation(spm, experiment=experiment, parameter_values=parameter_values)
sol= sim.solve(save_at_cycles=100)
capacity = []
voltage = []
capacity=sol['Total lithium capacity [A.h]'].data
voltage=sol["Terminal voltage [V]"].data
fig,ax = plt.subplots(tight_layout=True)
ax.plot(capacity, voltage, label="Ah")
ax.set_xlabel('Capacity [Ah]')
ax.set_ylabel('Voltage [V]')
ax.legend(loc='best')
plt.show()
Here's the result!
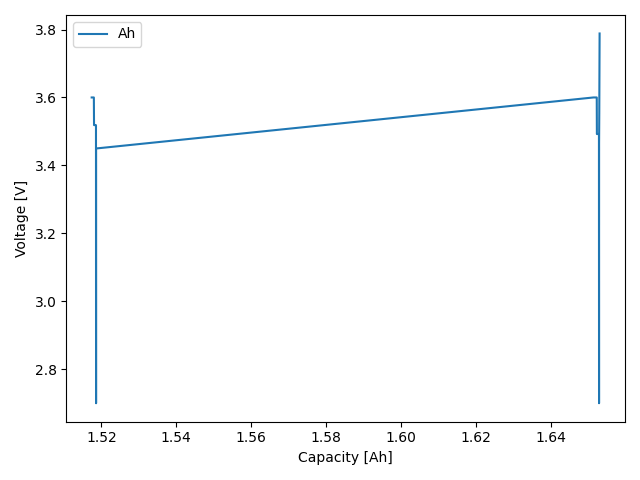
I have questions about this.
I would be very grateful if you could reply. I really hope you do it.
Beta Was this translation helpful? Give feedback.
All reactions