You signed in with another tab or window. Reload to refresh your session.You signed out in another tab or window. Reload to refresh your session.You switched accounts on another tab or window. Reload to refresh your session.Dismiss alert
reacted with thumbs up emoji reacted with thumbs down emoji reacted with laugh emoji reacted with hooray emoji reacted with confused emoji reacted with heart emoji reacted with rocket emoji reacted with eyes emoji
Uh oh!
There was an error while loading. Please reload this page.
Uh oh!
There was an error while loading. Please reload this page.
-
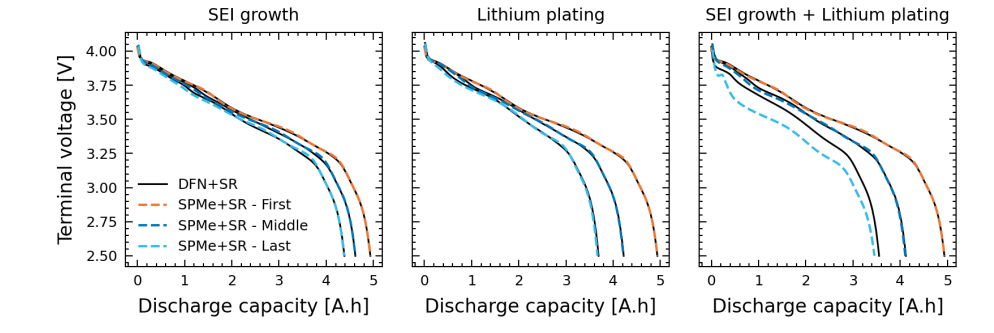
Hello, I want to plot discharge voltage curve though pybamm, by a long-time cycling simulation (1000 cycles)

https://github.com/pybamm-team/PyBaMM/blob/develop/examples/notebooks/simulating-long-experiments.ipynb
I want to draw a discharge curve for each cycle(ex. "10" cycle).
So I'm analyzing the code(https://github.com/pybamm-team/PyBaMM/blob/develop/pybamm/simulation.py)
Question : What is the difference between [cycle_solution], [cycle_sum_vars], and [cycle_first_state] ?
Question2 : What is the difference between save_at_cycles and solution.all_first_states? (#2250)
Beta Was this translation helpful? Give feedback.
All reactions