Replies: 2 comments 3 replies
-
|
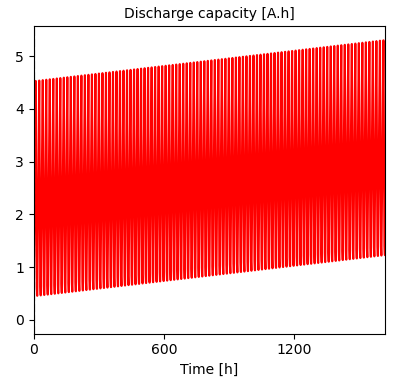
Hi~ This is linked to the definition of the variables "Discharge capacity [A.h]" in PyBaMM, as can be seen here, it is just an intergration of current over time, whose integral lower limit is fixed to t=0. I can see from your figure that the upper and lower boundary seem to increase equally, so the discharge capacity may always be the same. |
Beta Was this translation helpful? Give feedback.
-
|
Thank you @RuiheLi for the reply, |
Beta Was this translation helpful? Give feedback.
-
|
Hi @pkalbhor, The link I provided is not the true definition of Discharge capacity recognized by the battery comminuty, it is just how PyBaMM calculate the variable Discharge capacity. You need to do what the pasted script do to get Discharge capacity. |
Beta Was this translation helpful? Give feedback.
-
|
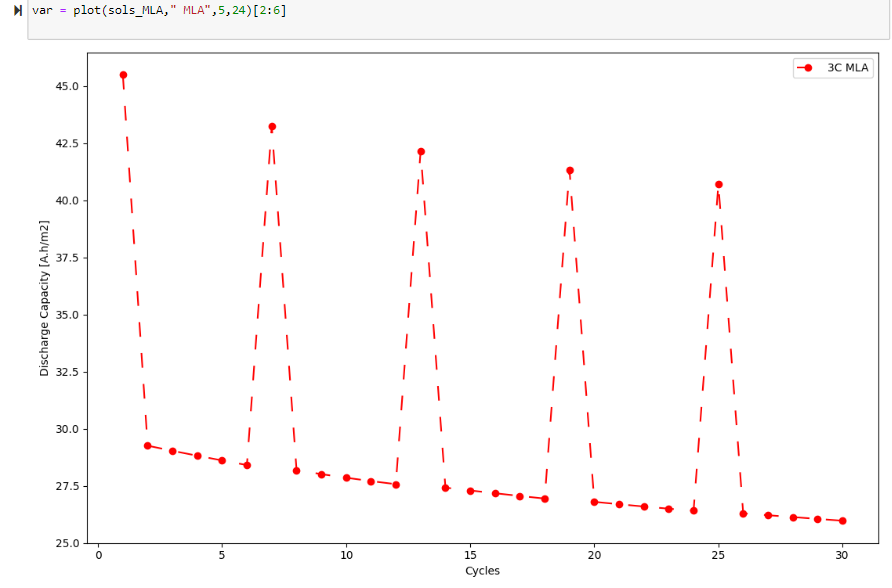
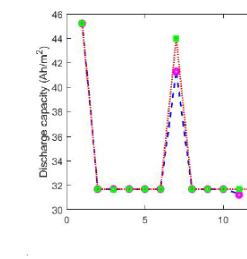
Hello @RuiheLi, I am having a similar problem. I am cycling with plating and sei formation and get a graph like this: when I am expecting something with flat minimums like this: This is the experiment I use: `C_rates = ["3C"] #want to grab steps [0, 4, 8, 12, 16, 20] ] * 5, And this is the code I use to extract the discharge capacity, def plot(sims,state,cycles,num_step): Using the pasted script above didn't really change anything and I was wondering if I used that wrong or if I am missing something else. Any help would be greatly appreciated. |
Beta Was this translation helpful? Give feedback.
-
|
Hi~ May I ask what is the definition of is doing extactly what you expected, by plotting the voltage curve of the specific step. |
Beta Was this translation helpful? Give feedback.
Uh oh!
There was an error while loading. Please reload this page.
-
Disclaimer: I just started exploring PyBaMM. Please let me know if I am breaking any guidelines here in the discussion.
I tried default models like below:
See below plot. I wonder what is logical explanation for this behavior of discharge capacity, why would it increase over time/cycle index?
Beta Was this translation helpful? Give feedback.
All reactions