Techempower benchmark spends 4% of time in volatile field access? #30473
Replies: 8 comments 7 replies
-
|
Yes, I am actually one of the JCTools developer and it's due to skidding. Mpsc offering makes uses of compare and set operations that, on x86, make uses of full barrier (in the form of lock prefixed ASM instructions), that's rather costy and interact with the store buffer of CPUs. You can use perf itself and/or intel Vtune (now freely available) and it will show that the cost is "near" such instructions (right after it), and sadly the profiler can just blame the nearest Byte Code Index can find by looking forward (perf java map will likely blame the previous one and it won't use async get call trace, but the real frame pointer, maybe still missing the right istr to blame). A similar issue happened here too: JCTools/JCTools#288 In async profiler you can have some fun with some finer grain investigation (still considering the skid + inlining async get call trace limitations) by using a JFR output format and converting it using the ap jfr2flame converter using the --lines option, that will produce a flamegraphs using the relevant line of code instead of just methods (wrong, as previously said). |
Beta Was this translation helpful? Give feedback.
-
|
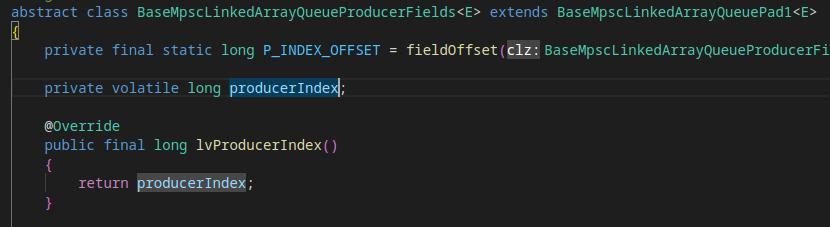
I was a little confused because there is a getter method
At any rate, if
|
Beta Was this translation helpful? Give feedback.
-
|
I think they are both wrong and I don't think using other threads will make any difference because:
In some old version of Netty we used a different mechanism to recycle objs, making uses of batched thread local offers, way less costly, but with some wider effects on GC behaviour, then abandoned. |
Beta Was this translation helpful? Give feedback.
-
|
Hi @franz1981 , with the TSC clocksource now working, I re-ran with async-profiler a couple of times. In each flamegraph,
So I guess if I find anything that contains |
Beta Was this translation helpful? Give feedback.
-
|
The timer interrupts come from APIC IRQ handling (that's specific per CPU) while they "seems" (they could or not, really, due to skidding, none knows) to be on CPU, but it happens regardless what the program is doing in user-space, it's not "provoked" by the user call-stack recorded. |
Beta Was this translation helpful? Give feedback.
-
|
Alright, I asked them here: asm_sysvec_apic_timer_interrupt attributed wrongly to arbitrary stack trace? #710 |
Beta Was this translation helpful? Give feedback.
-
|
Alright, it turns out I was confused by flamegraph always showing details of Please see below comment below for continued discussion. |
Beta Was this translation helpful? Give feedback.
-
|
@franz1981 concerning Netty #13153, did you consider that my original observation here might be wrong, as |
Beta Was this translation helpful? Give feedback.
-
|
|
Beta Was this translation helpful? Give feedback.
-
|
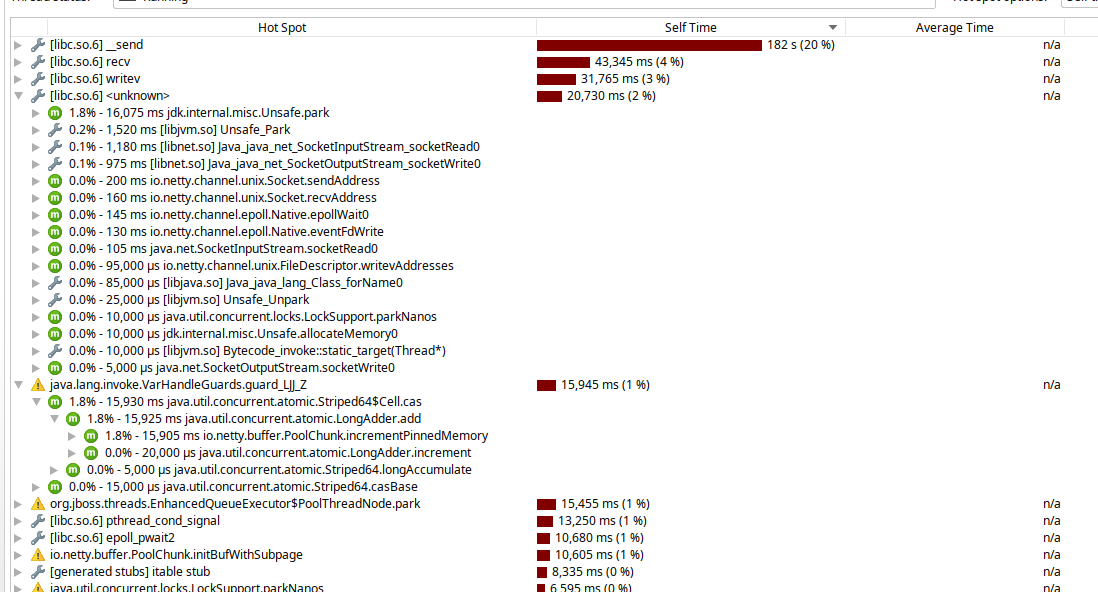
With TSC and async profiling, these are now the hotspots as reported by JProfiler (replacing the first screenshot I posted here):
|
Beta Was this translation helpful? Give feedback.
-
|
I cannot see any apic related stack trace, or am I reading it wrong? |
Beta Was this translation helpful? Give feedback.
-
|
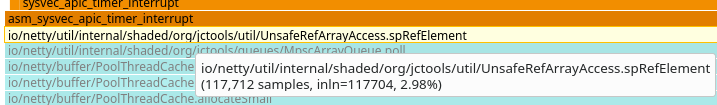
It's in the second screenshot of my first posting, where I (tried) to show related observation from async-profiler HTML dump
|

Beta Was this translation helpful? Give feedback.
-
|
Hi @franz1981 , across a good number of flamegraphs and HTML dumps that I took, |
Beta Was this translation helpful? Give feedback.
-
|
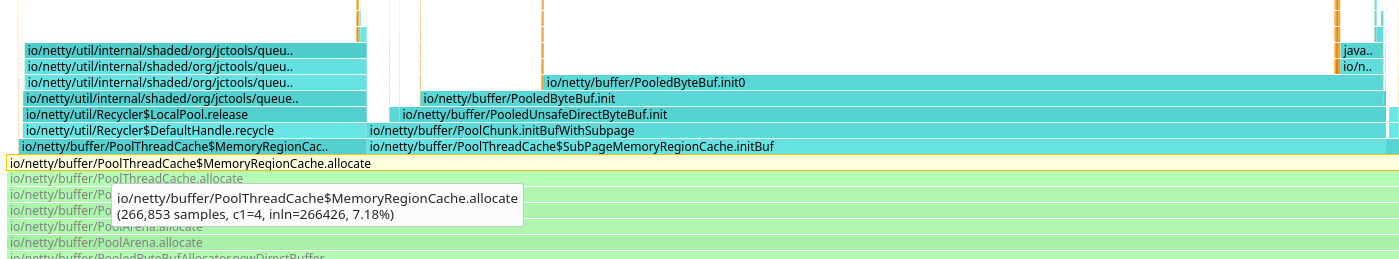
Hi @franz1981 , as pointed out in the async-profiler discussion, all three findings are around volatile field access (for details please see there). This is the flamegraph that found two of them at the same time, amounting to 7.18% in |
Beta Was this translation helpful? Give feedback.
-
|
As said, I won't trust that much exact definition of the guilty functions here, given that there is a lot of inlining and there are full memory barrier-like operations in place. |
Beta Was this translation helpful? Give feedback.
Uh oh!
There was an error while loading. Please reload this page.
-
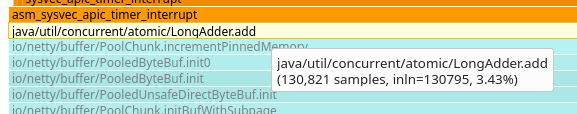
Hi @franz1981 , in the hope that this won't be another public exercise of a flawed test setup, here is no. 4 of the hotspots reported by JProfiler async profiling (on a Linux x86 host) of the Techempower benchmark:
Something similar shows up with async-profiler
-e cycles:This is actually a field access of a volatile field, i.e. it's not cached in CPU registers or L1 - L3 caches. Do you perhaps see something similar in your flamegraphs?
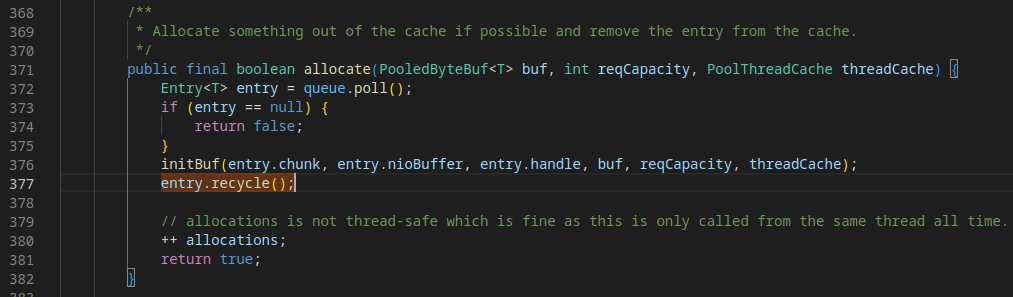
This looks like some kind of memory cleanup (
Entry.recycle()) happening in threads that write responses. First thing I'd wonder is whether this could be offloaded to happen asynchronously, so the writing threads aren't blocked on this.Beta Was this translation helpful? Give feedback.
All reactions