-
|
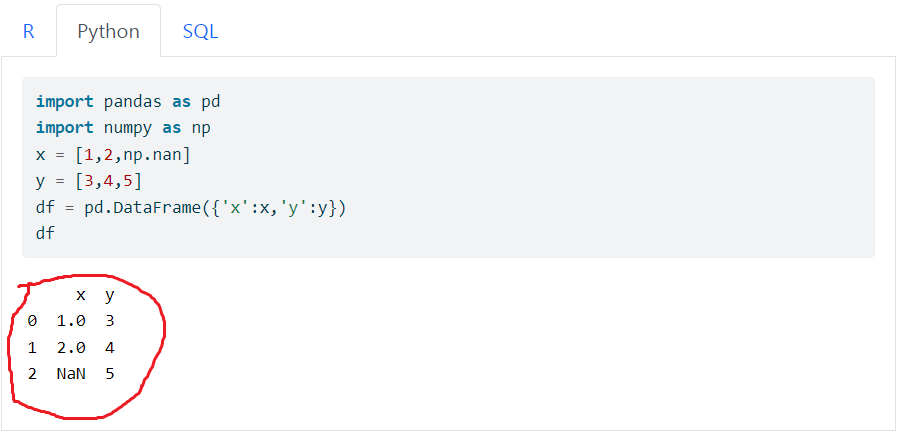
I'm writing a Quarto document where I mix R, Python, and SQL code chunks. In each language I end up printing a table of data. However, tables are rendered differently. Is there a way to set a global rule to ensure that all tables, regardless of language, will be in the same format/aesthetics? In other words, is this a feature Quarto already has? I did use but it seems to affect only tables resulting from R code chunks. The Python table ( And the SQL table is just a thing of its own, although somewhat similar to R's table: Is there a way to make all tables be rendered in the same format/style?
|


Beta Was this translation helpful? Give feedback.
Replies: 5 comments 7 replies
-
|
Write or use something that produces the same HTML/CSS output, or leave all the styling to Quarto by "printing" markdown tables. To note, Quarto cannot standardise outputs of nearly infinity of functions designed to output tables (or anything), e.g., in R, there is already |
Beta Was this translation helpful? Give feedback.
-
|
Thanks for replying!
Could you elaborate on that or suggest how? I'm pretty new to quarto so would appreciate any guidance :) |
Beta Was this translation helpful? Give feedback.
-
|
This is independent of Quarto. Or write/use function printing markdown, such as To note |
Beta Was this translation helpful? Give feedback.
-
|
I see. Well unfortunately I don't know how to go about this. For instance, I have no clue how the |
Beta Was this translation helpful? Give feedback.
-
|
You could use your browser developer mode to look at the table and the associated CSS, then overwrite it to your convenience. |
Beta Was this translation helpful? Give feedback.
-
|
I found a It is not perfect. It relies on an additional R chunk to print the dataframe/tibble/python-DataFrame/SQL-table. But it does work and it gives a consistent look to all tables in the ```{r}
#| echo: false
library(reticulate)
use_virtualenv("./env", required = TRUE)
```
## Set up SQL
```{r}
# R
library(DBI)
library(duckdb)
library(ggplot2)
```
```{r}
# R
## create connection to SQL database
con <- DBI::dbConnect(duckdb::duckdb(), dbdir = "duckdb")
## copy mpg dataset from ggplot2 onto the SQL database, via `con`
dbWriteTable(con, "mpg", ggplot2::mpg, overwrite = TRUE)
```
## Print tables from R, Python, and SQL in panel tabset
```{r}
#| echo: false
# display NaN cells in DT::datatable()
options(htmlwidgets.TOJSON_ARGS = list(na = 'string')) # https://stackoverflow.com/a/48694410/6105259
print_as_dt <- function(x){
DT::datatable(x,
rownames = FALSE,
options = list(
dom = 'ltipr', # to remove search box; https://stackoverflow.com/a/61952067/6105259
autoWidth = TRUE,
columnDefs = list(
list(className = 'dt-left', targets = "_all"),
list(width = '200px', targets = "_all")
)
)
)
}
```
::: {.panel-tabset}
## R
```{r}
ggplot2::mpg |>
dplyr::select(manufacturer, displ, cty) |>
print_as_dt()
```
## Python
```{python}
import pandas as pd
import numpy as np
x = [1,2,np.nan]
y = [3,4,5]
df = pd.DataFrame({'x':x,'y':y})
```
```{r}
#| echo: false
print_as_dt(py$df)
```
## SQL
```{sql}
#| connection: con
#| output.var: "tab_sql"
SELECT manufacturer, displ, cty
FROM mpg;
```
```{r}
#| echo: false
print_as_dt(tab_sql)
```
:::
|
Beta Was this translation helpful? Give feedback.
-
|
That's a clever workaround, I like it! Quarto currently doesn't have such a feature. We'll be working on it in the next 3-6 months. In the meantime, the issue is that we defer the styling of the tables to individual libraries, and different libraries tend to make different choices. We want to design something that allows libraries the option to control formatting, while also providing an option for quarto to take over formatting. Still, I like your idea of serializing the table and sending it through your preferred library while we figure this all out. |
Beta Was this translation helpful? Give feedback.
-
|
Thanks, @cscheid. In fact, I realized that the solution I posted above with format:
html:
theme:
light: cosmo
dark: superheroSo I ended up with a different solution that relies on library(kableExtra)
print_table <- function(tbl, n_rows = 10){
tbl |>
head(n_rows) |>
kableExtra::kbl(row.names = FALSE) |>
kableExtra::kable_styling(bootstrap_options = "striped", full_width = FALSE, position = "left")
}This one works well with both light ( My knowledge of HTML and CSS is minimal, so I can't tell why some things work (e.g., my Also, the |
Beta Was this translation helpful? Give feedback.
-
|
Yes, you're seeing that because kable and DT::datatable are completely different implementations (which are also different from GT, or from flextables, or from pandas's table output.. As you can see, table printing is complicated :)) |
Beta Was this translation helpful? Give feedback.
-
|
Not an additional answer, but just commenting here to say that it would be wonderful if there was a way that df-paged could work outside R ... in fact there is nothing that tipped me off to it being R only. I drove Claude around in circles before figuring out that even CSS styling doesn't work here because reticulate output from pandas seems to be in |
Beta Was this translation helpful? Give feedback.
-
The option is only listed in the R section of the documentation: https://quarto.org/docs/computations/r.html#data-frames Note that this is a |
Beta Was this translation helpful? Give feedback.
-
|
Fair point! Apologies.
…On Thu, Oct 23, 2025 at 3:24 PM Mickaël Canouil ***@***.***> wrote:
there is nothing that tipped me off to it being R only.
The option is only listed in the R section of the documentation:
https://quarto.org/docs/computations/r.html#data-frames
I believe this to be different from "nothing".
—
Reply to this email directly, view it on GitHub
<#3253 (reply in thread)>,
or unsubscribe
<https://github.com/notifications/unsubscribe-auth/AAAWOUR7BXN37XPYS5DF6J33ZE2O7AVCNFSM6AAAAACKBNSX4CVHI2DSMVQWIX3LMV43URDJONRXK43TNFXW4Q3PNVWWK3TUHMYTINZWGYZDSMA>
.
You are receiving this because you commented.Message ID:
***@***.***>
|
Beta Was this translation helpful? Give feedback.
I found a
DT::datatable()solution based on this issue comment.It is not perfect. It relies on an additional R chunk to print the dataframe/tibble/python-DataFrame/SQL-table. But it does work and it gives a consistent look to all tables in the
.qmd-> HTML page, regardless of language.```{r} #| echo: false library(reticulate) use_virtualenv("./env", required = TRUE) ``` ## Set up SQL ```{r} # R library(DBI) library(duckdb) library(ggplot2) ``` ```{r} # R ## create connection to SQL database con <- DBI::dbConnect(duckdb::duckdb(), dbdir = "duckdb") ## copy mpg dataset from ggplot2 onto the SQL database, via `con` dbWriteTable(con, "mpg", ggplot2::mpg, overwrite = TRUE) ``` ## Print t…