Error message: could not find function "ojs_define" #683
-
|
I have just started using Quarto, but keep getting the error message - could not find function "ojs_define" when trying to define a value in an {r} code cell. Quarto version: v0.9.276 |
Beta Was this translation helpful? Give feedback.
Replies: 1 comment 3 replies
-
|
Hi - sorry you're running into trouble. I'm having a hard time reproducing your example. Can you please take the following code: save it as |
Beta Was this translation helpful? Give feedback.
-
|
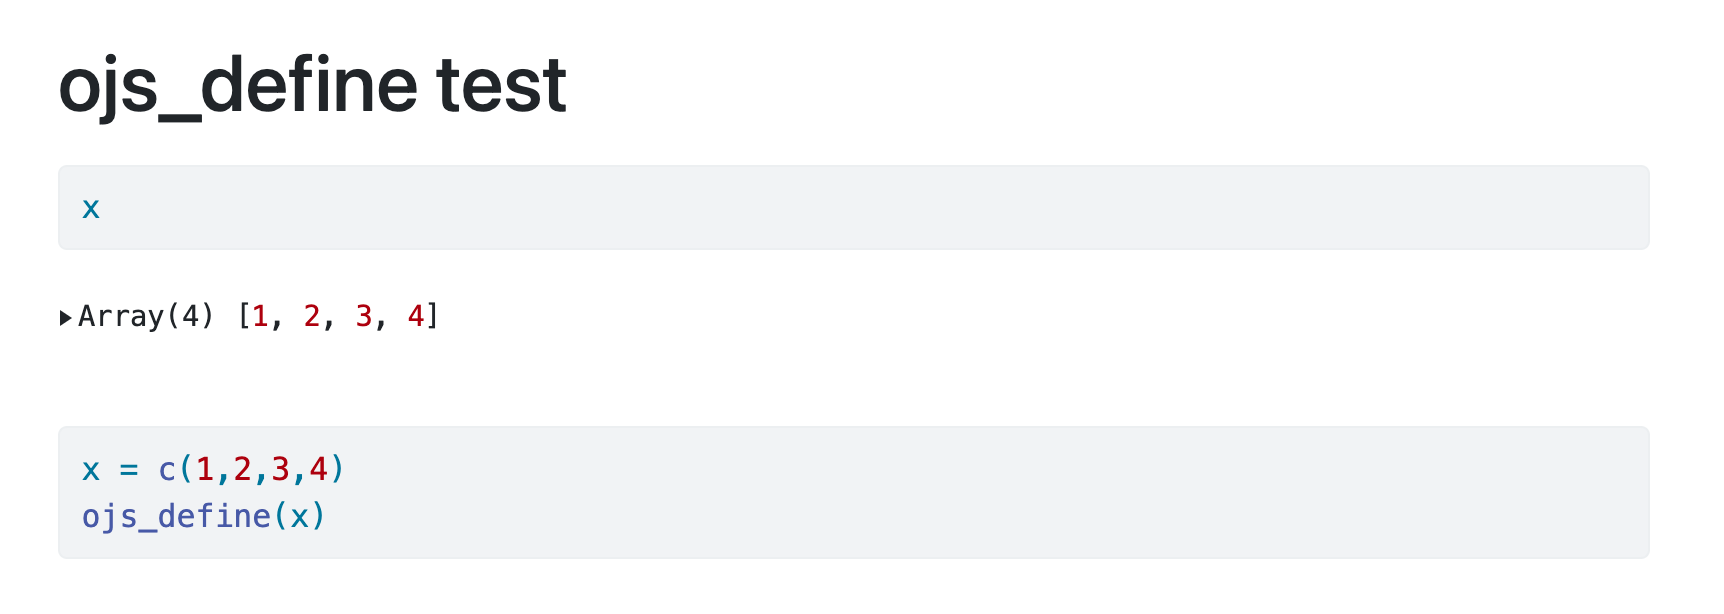
I realize now that it's possible you weren't running a This produces the following output for me:
Can you describe your installation and environment in more detail?
|
Beta Was this translation helpful? Give feedback.
-
|
Thank you for the example, I have now got this working. |
Beta Was this translation helpful? Give feedback.
-
|
I was expecting the function to work in R but it doesn't, it work on Render. ::face-palm:: @cscheid your example tie the missing understanding together for me. Appreciate you! |
Beta Was this translation helpful? Give feedback.
Hi - sorry you're running into trouble.
I'm having a hard time reproducing your example. Can you please take the following code: