Replies: 1 comment
-
|
By Can you share a reproducible example that I could run on my side ? Which package you are using and which dataset ? I don't know how to find Also, @rich-iannone is looking to improve gt outputs for Quarto document, maybe this would help the gtsummary package that I think is using gt as backend. |
Beta Was this translation helpful? Give feedback.
0 replies
Sign up for free
to join this conversation on GitHub.
Already have an account?
Sign in to comment
Uh oh!
There was an error while loading. Please reload this page.
-
I am having a problem rendering a PDF document with tables created with the tbl_summary package. They display properly when rendered to HTML, though.
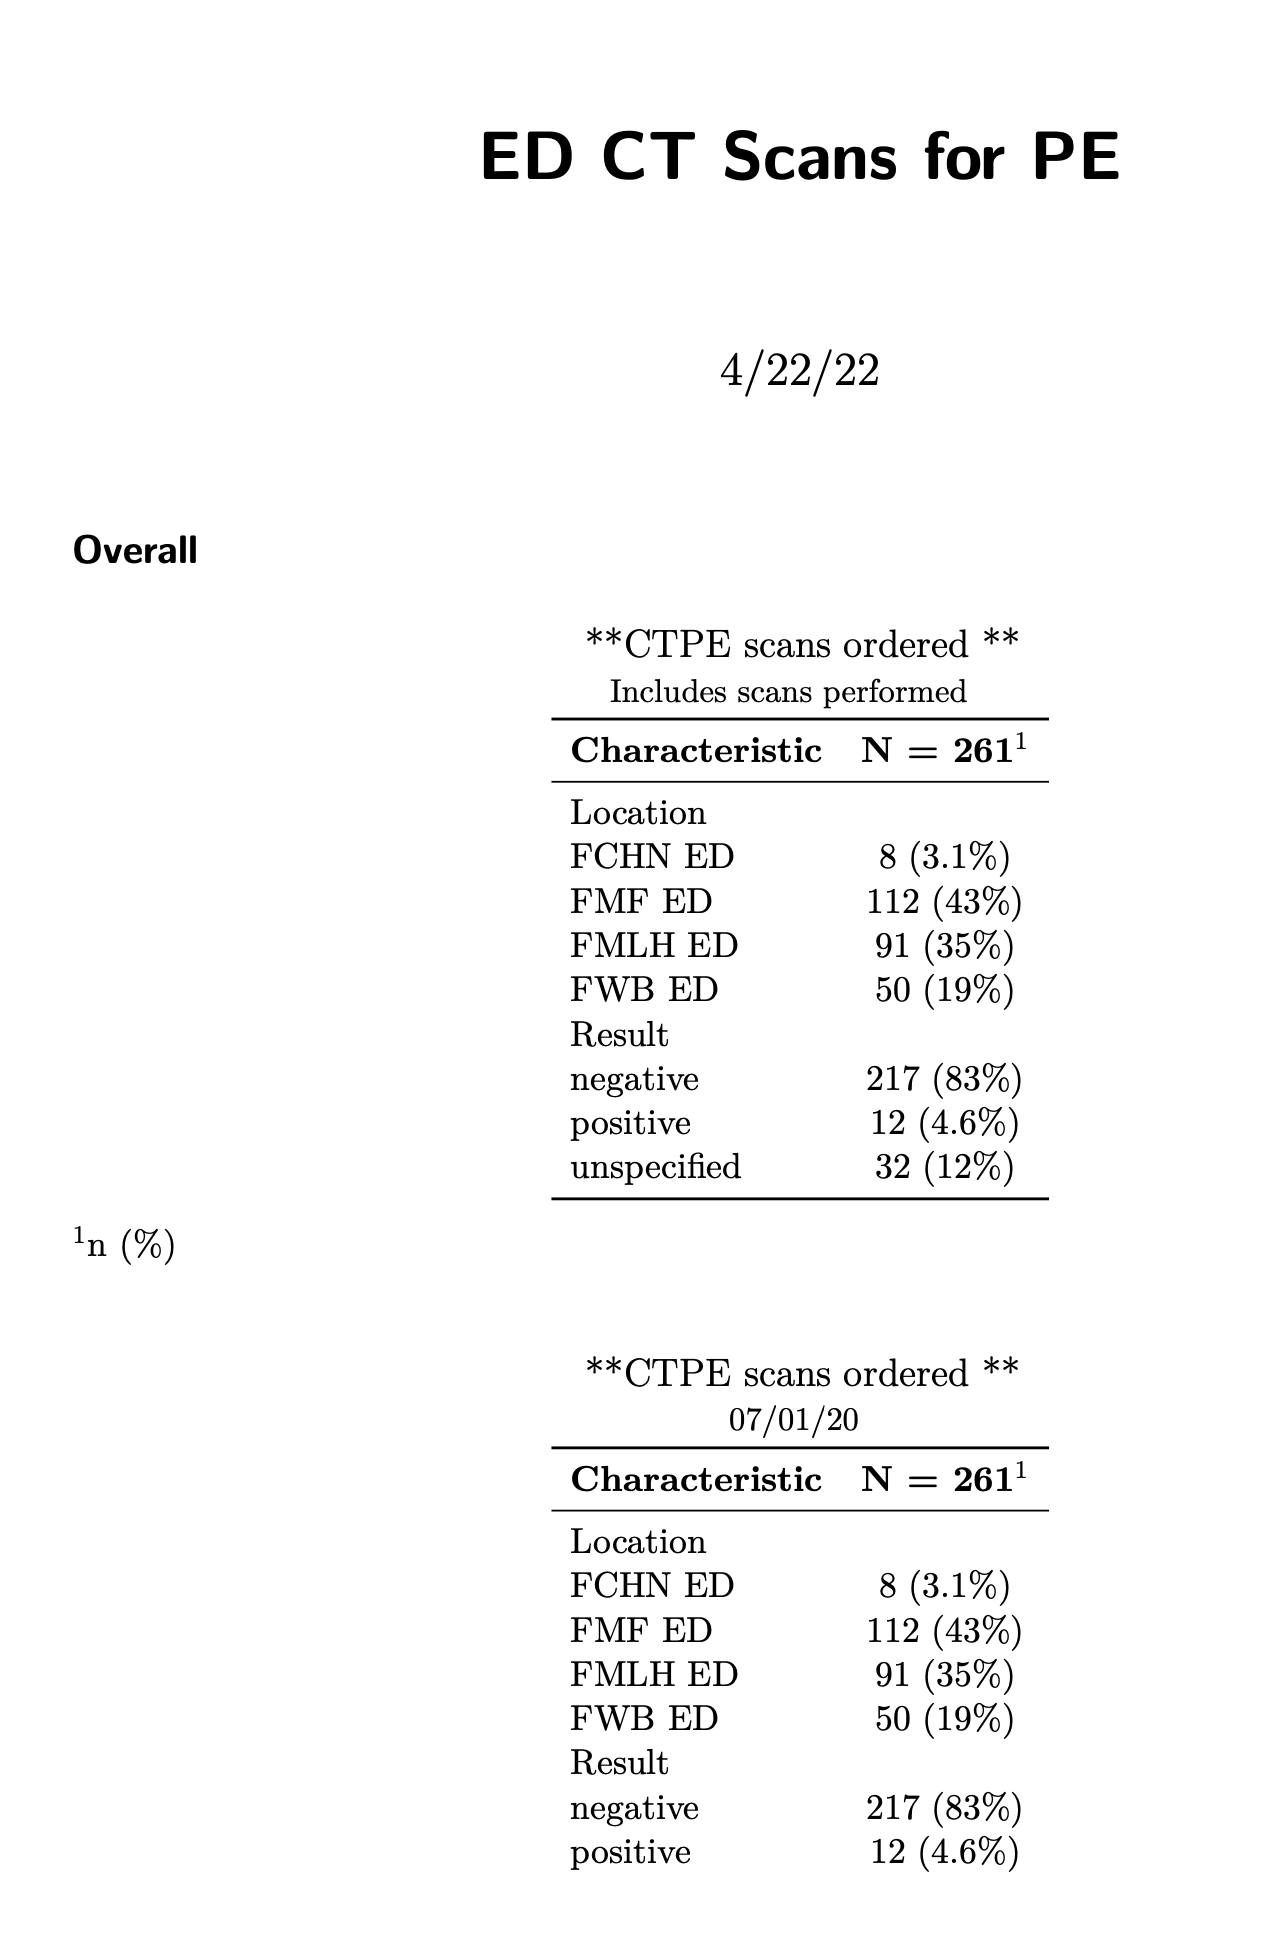
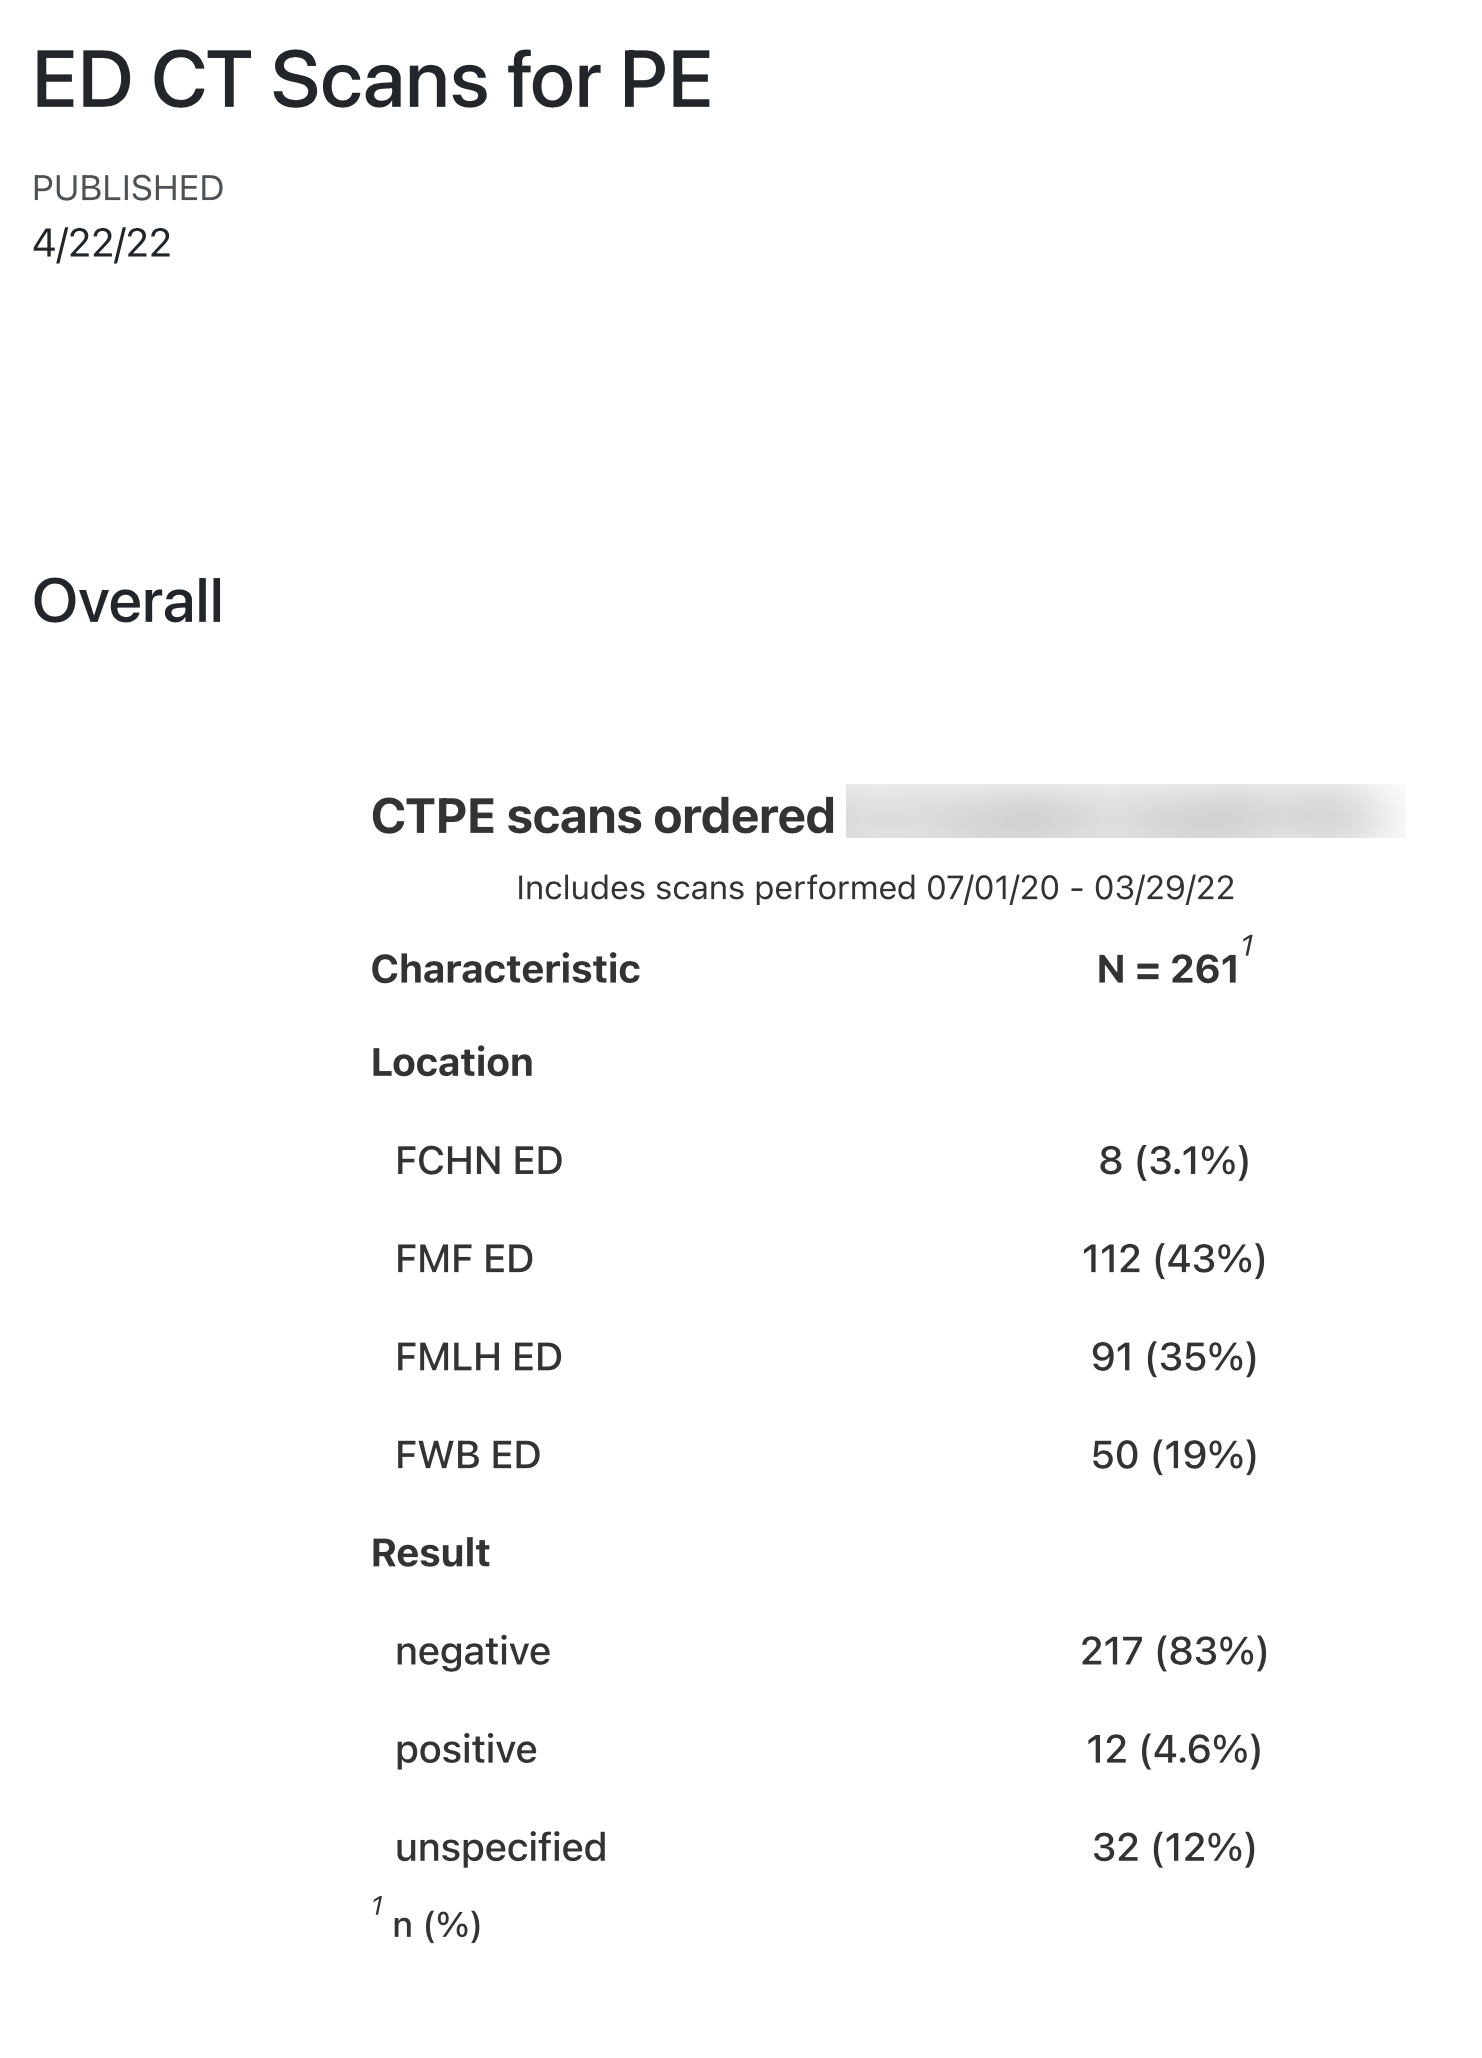
Below is a sample of the R code along with examples of how it displays correctly when rendered to HTML (fonts, subtitle with min and max dates, formatting) as compared to the PDF example. I've tried multiple PDF engines and they all look the same. Am I missing something?
R code-
`t1 = ctpe.data %>%
select(site, result) %>%
tbl_summary(
label = list(
site ~ "Location",
result ~ "Result"
)
) %>%
bold_labels() %>%
as_gt ()%>%
opt_row_striping() %>%
opt_table_lines("none") %>%
tab_header(
title = md("CTPE scans ordered in XXX"),
subtitle = c("Includes scans performed ", format(min(cleaned.data$date_time),"%m/%d/%y"), "-", format(max(cleaned.data$date_time),"%m/%d/%y"))
) %>%
opt_table_font(
font = google_font("Roboto Condensed"),
weight = 500
)
`
PDF sample-
HTML sample-
Beta Was this translation helpful? Give feedback.
All reactions