Replies: 11 comments 13 replies
-
|
That's unexpected (we fixed a similar issue in 3.9.8 where connection-related memory usage would be classified as Also, if you have the Grafana/Prometheus deployed, at least some screenshots from what's going on in the cluster would be helpful. |
Beta Was this translation helpful? Give feedback.
-
|
Thank you for reply, will provide this information once being hit again. |
Beta Was this translation helpful? Give feedback.
-
|
Got this: `Memory Total memory used: 4.1823 gb other_proc: 1.2033 gb (24.81 %) |
Beta Was this translation helpful? Give feedback.
-
|
System is somewhere unresponsive: |
Beta Was this translation helpful? Give feedback.
-
|
One more detail. When it (rabbitmq-server) hangs and is restarted, then it's very slow/unresponsive on startup with log messages like |
Beta Was this translation helpful? Give feedback.
-
|
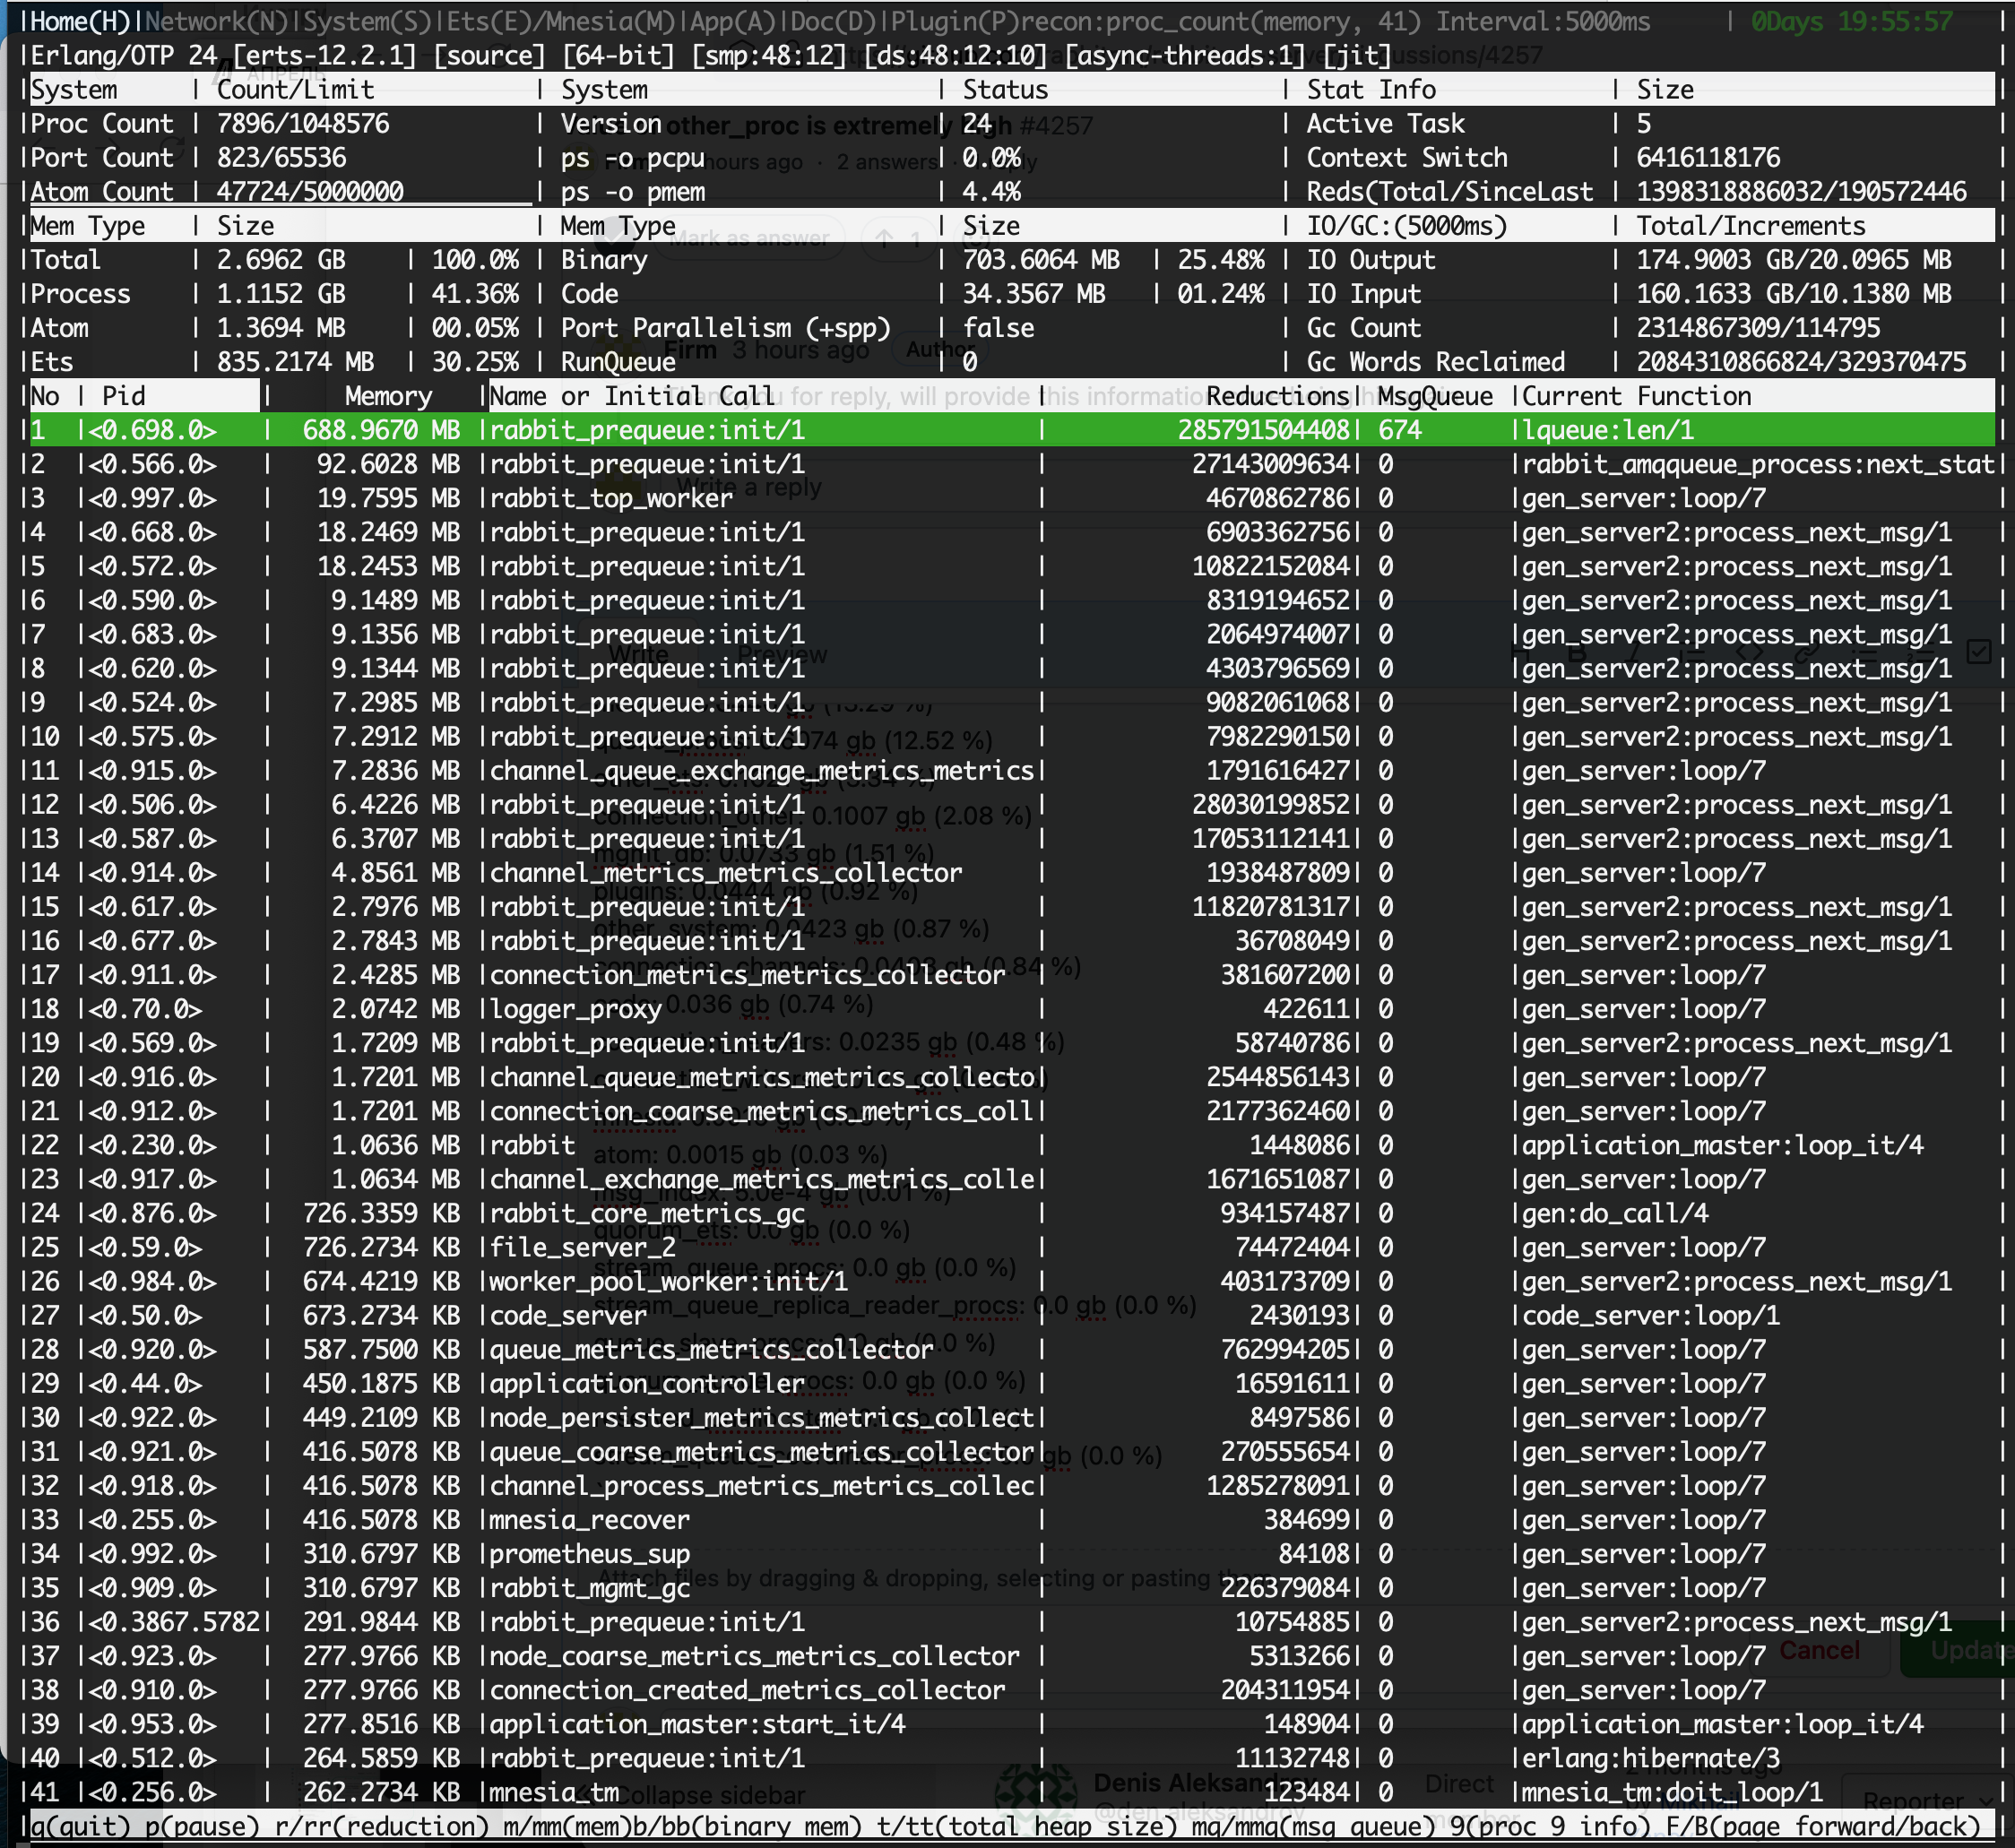
Was able to catch diagnostic data from almost unresponsive server.
|
Beta Was this translation helpful? Give feedback.
-
|
Btw, interesting thing: number of async-threads is 1, although it was set to 64 in #212 (almost 7 years ago). Currently I'm running 3.9.13-1 with 24.3.2 erlang package version. |
Beta Was this translation helpful? Give feedback.
-
|
Erlang's I/O subsystem has changed in recent years and some settings are ignored. |
Beta Was this translation helpful? Give feedback.
-
|
But why has async-threads default value changed from 64 to 1 once again? |
Beta Was this translation helpful? Give feedback.
-
|
Async threads are no longer used by the VM. The relevant option is now |
Beta Was this translation helpful? Give feedback.
-
|
Questions / asks:
|
Beta Was this translation helpful? Give feedback.
-
|
Classic non-mirrored queues that expect to have 12M messages must be lazy, otherwise if their publishers ever publish messages as transient, RabbitMQ will be instructed to keep as many of them as possible in memory. According to the top output, there is a bunch of queues at "init" stage which means they are just starting, and a process group |
Beta Was this translation helpful? Give feedback.
-
|
I have tried lazy queues but was stuck with high disk i/o (as lazy queue policy tries to store all messages to disk). |
Beta Was this translation helpful? Give feedback.
-
|
Well, there is no option that doesn't incur either a high disk I/O or some form of memory pressure, which can eventually manifest itself as short-lived Erlang processes within the node piling up. Lazy queues or quorum queues or a stream are your only viable options for tens of millions of messages. |
Beta Was this translation helpful? Give feedback.
-
|
@lukebakken is there a way for us to verify if these may be disk space monitoring processes piling up? We have seen this a couple of times in recent months. |
Beta Was this translation helpful? Give feedback.
-
|
We (CloudAMQP) have seen this a few times: Check: |
Beta Was this translation helpful? Give feedback.
-
|
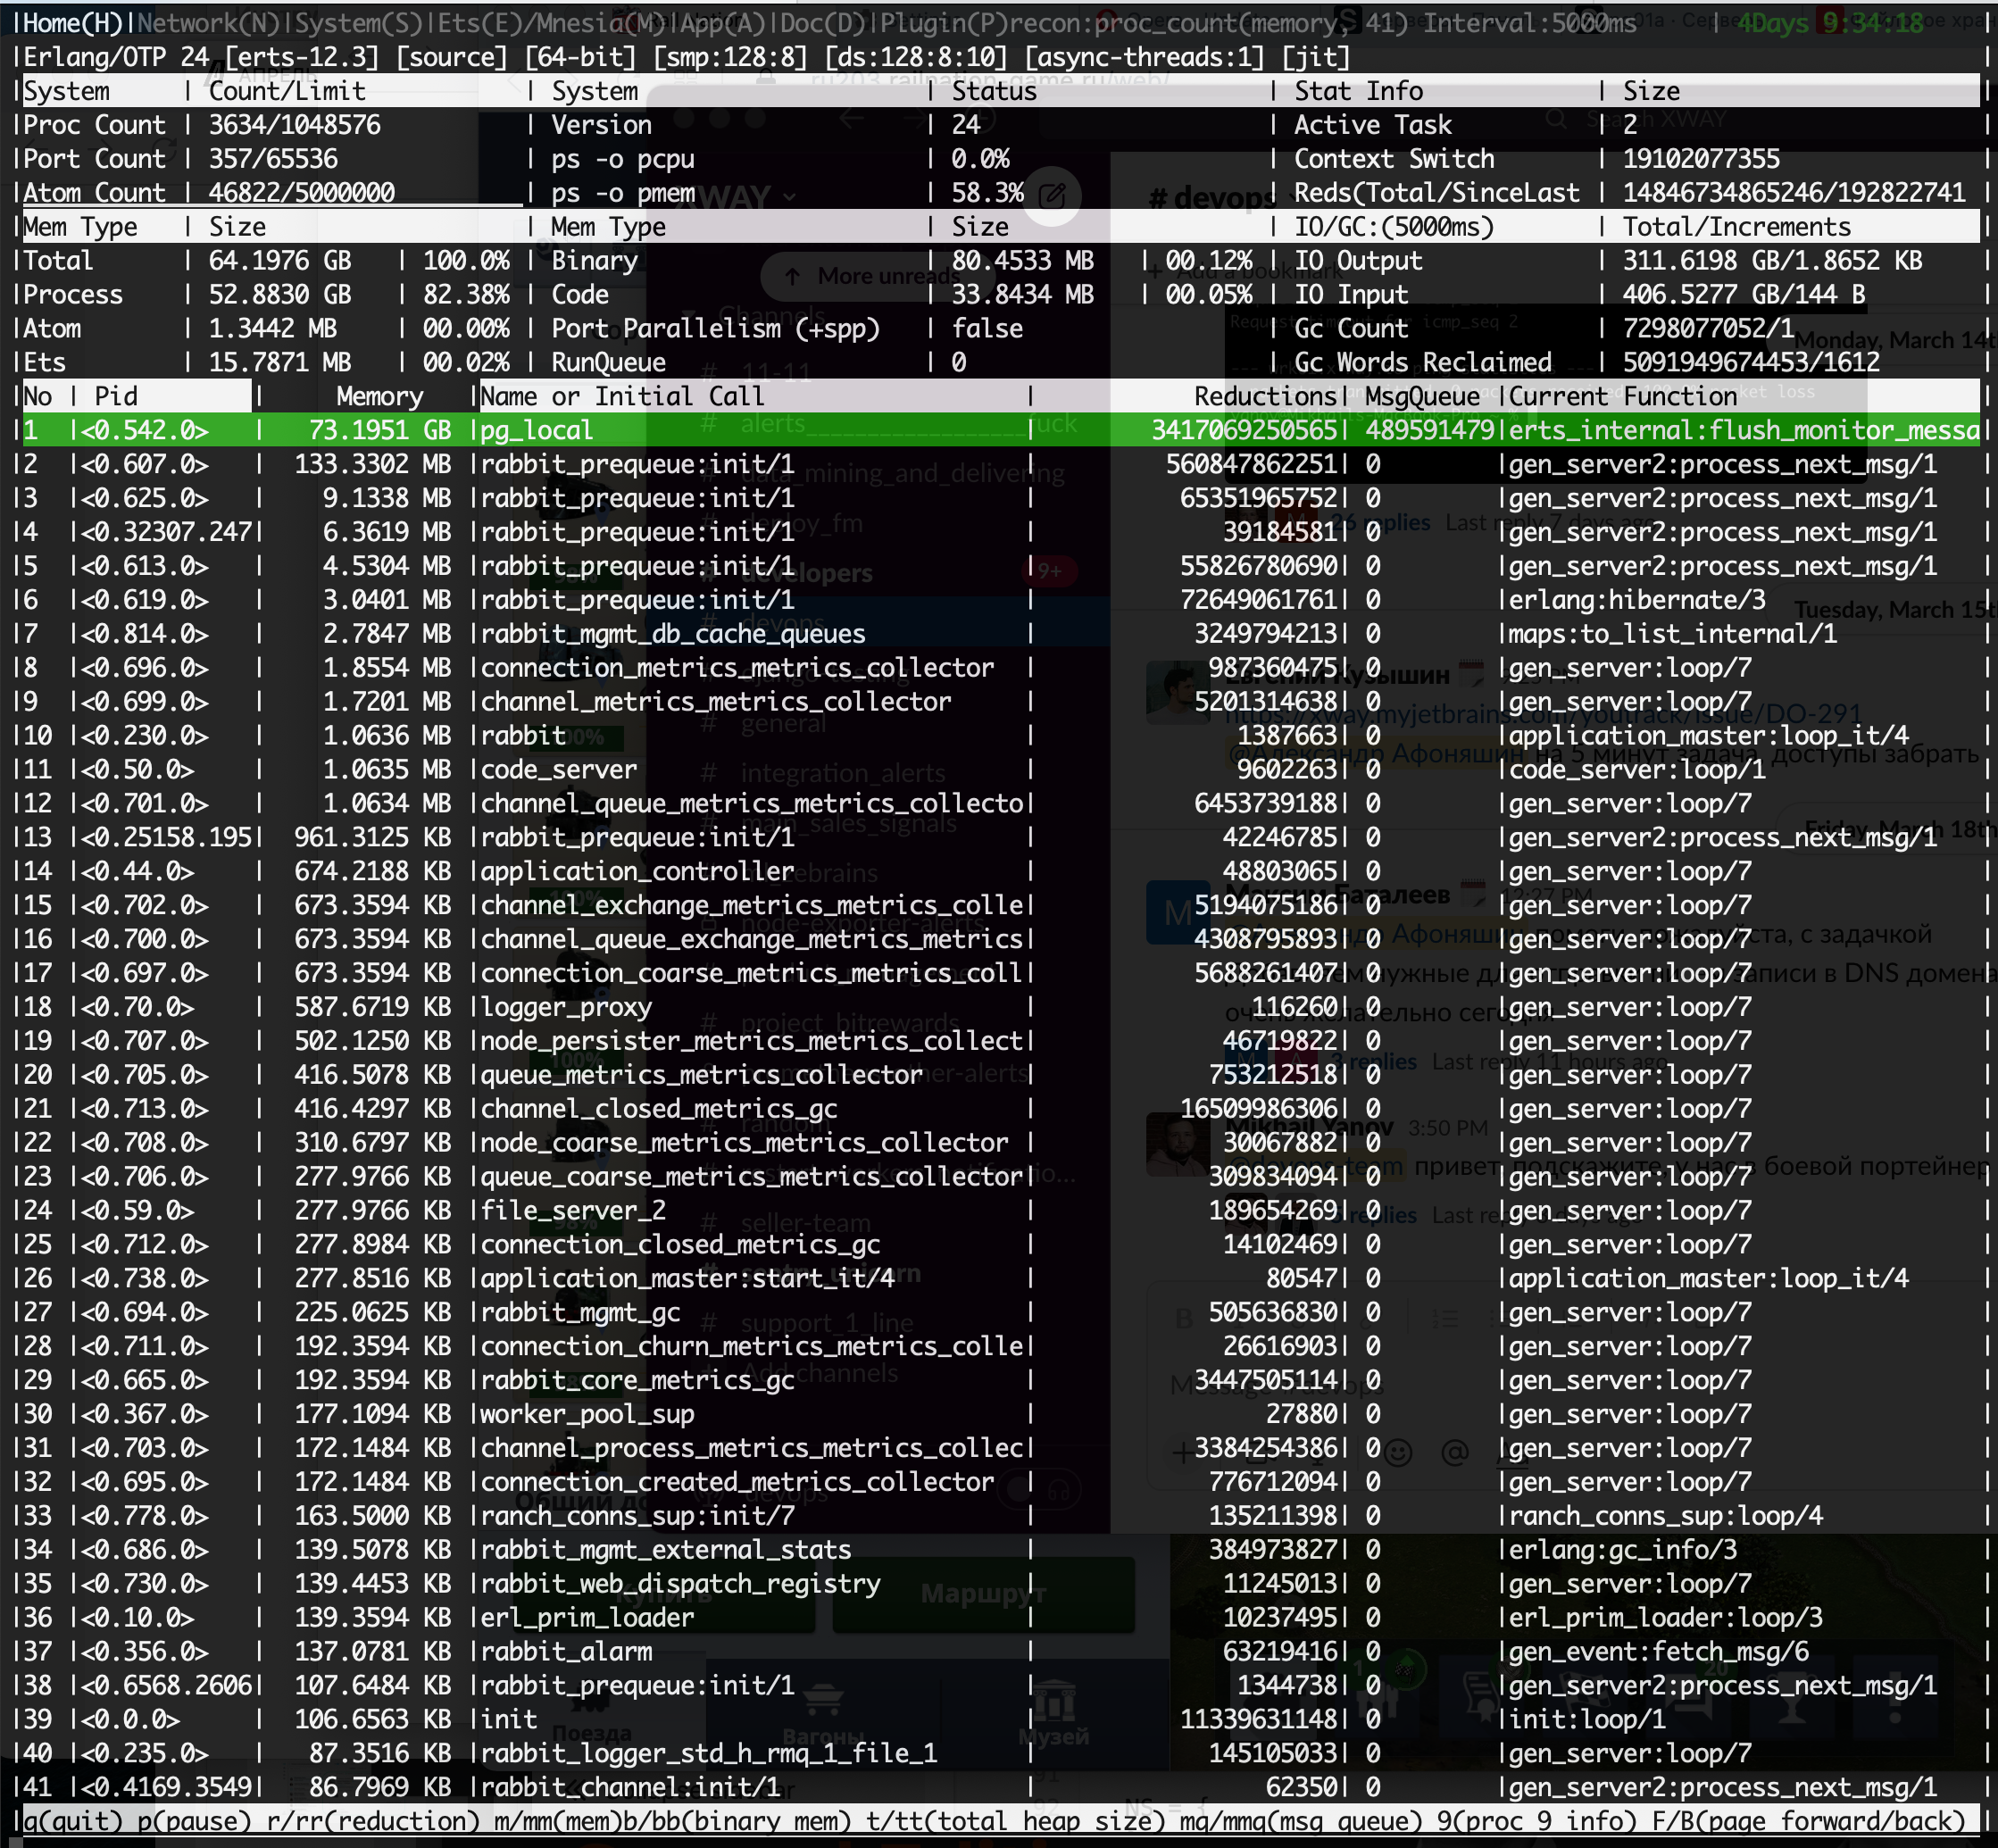
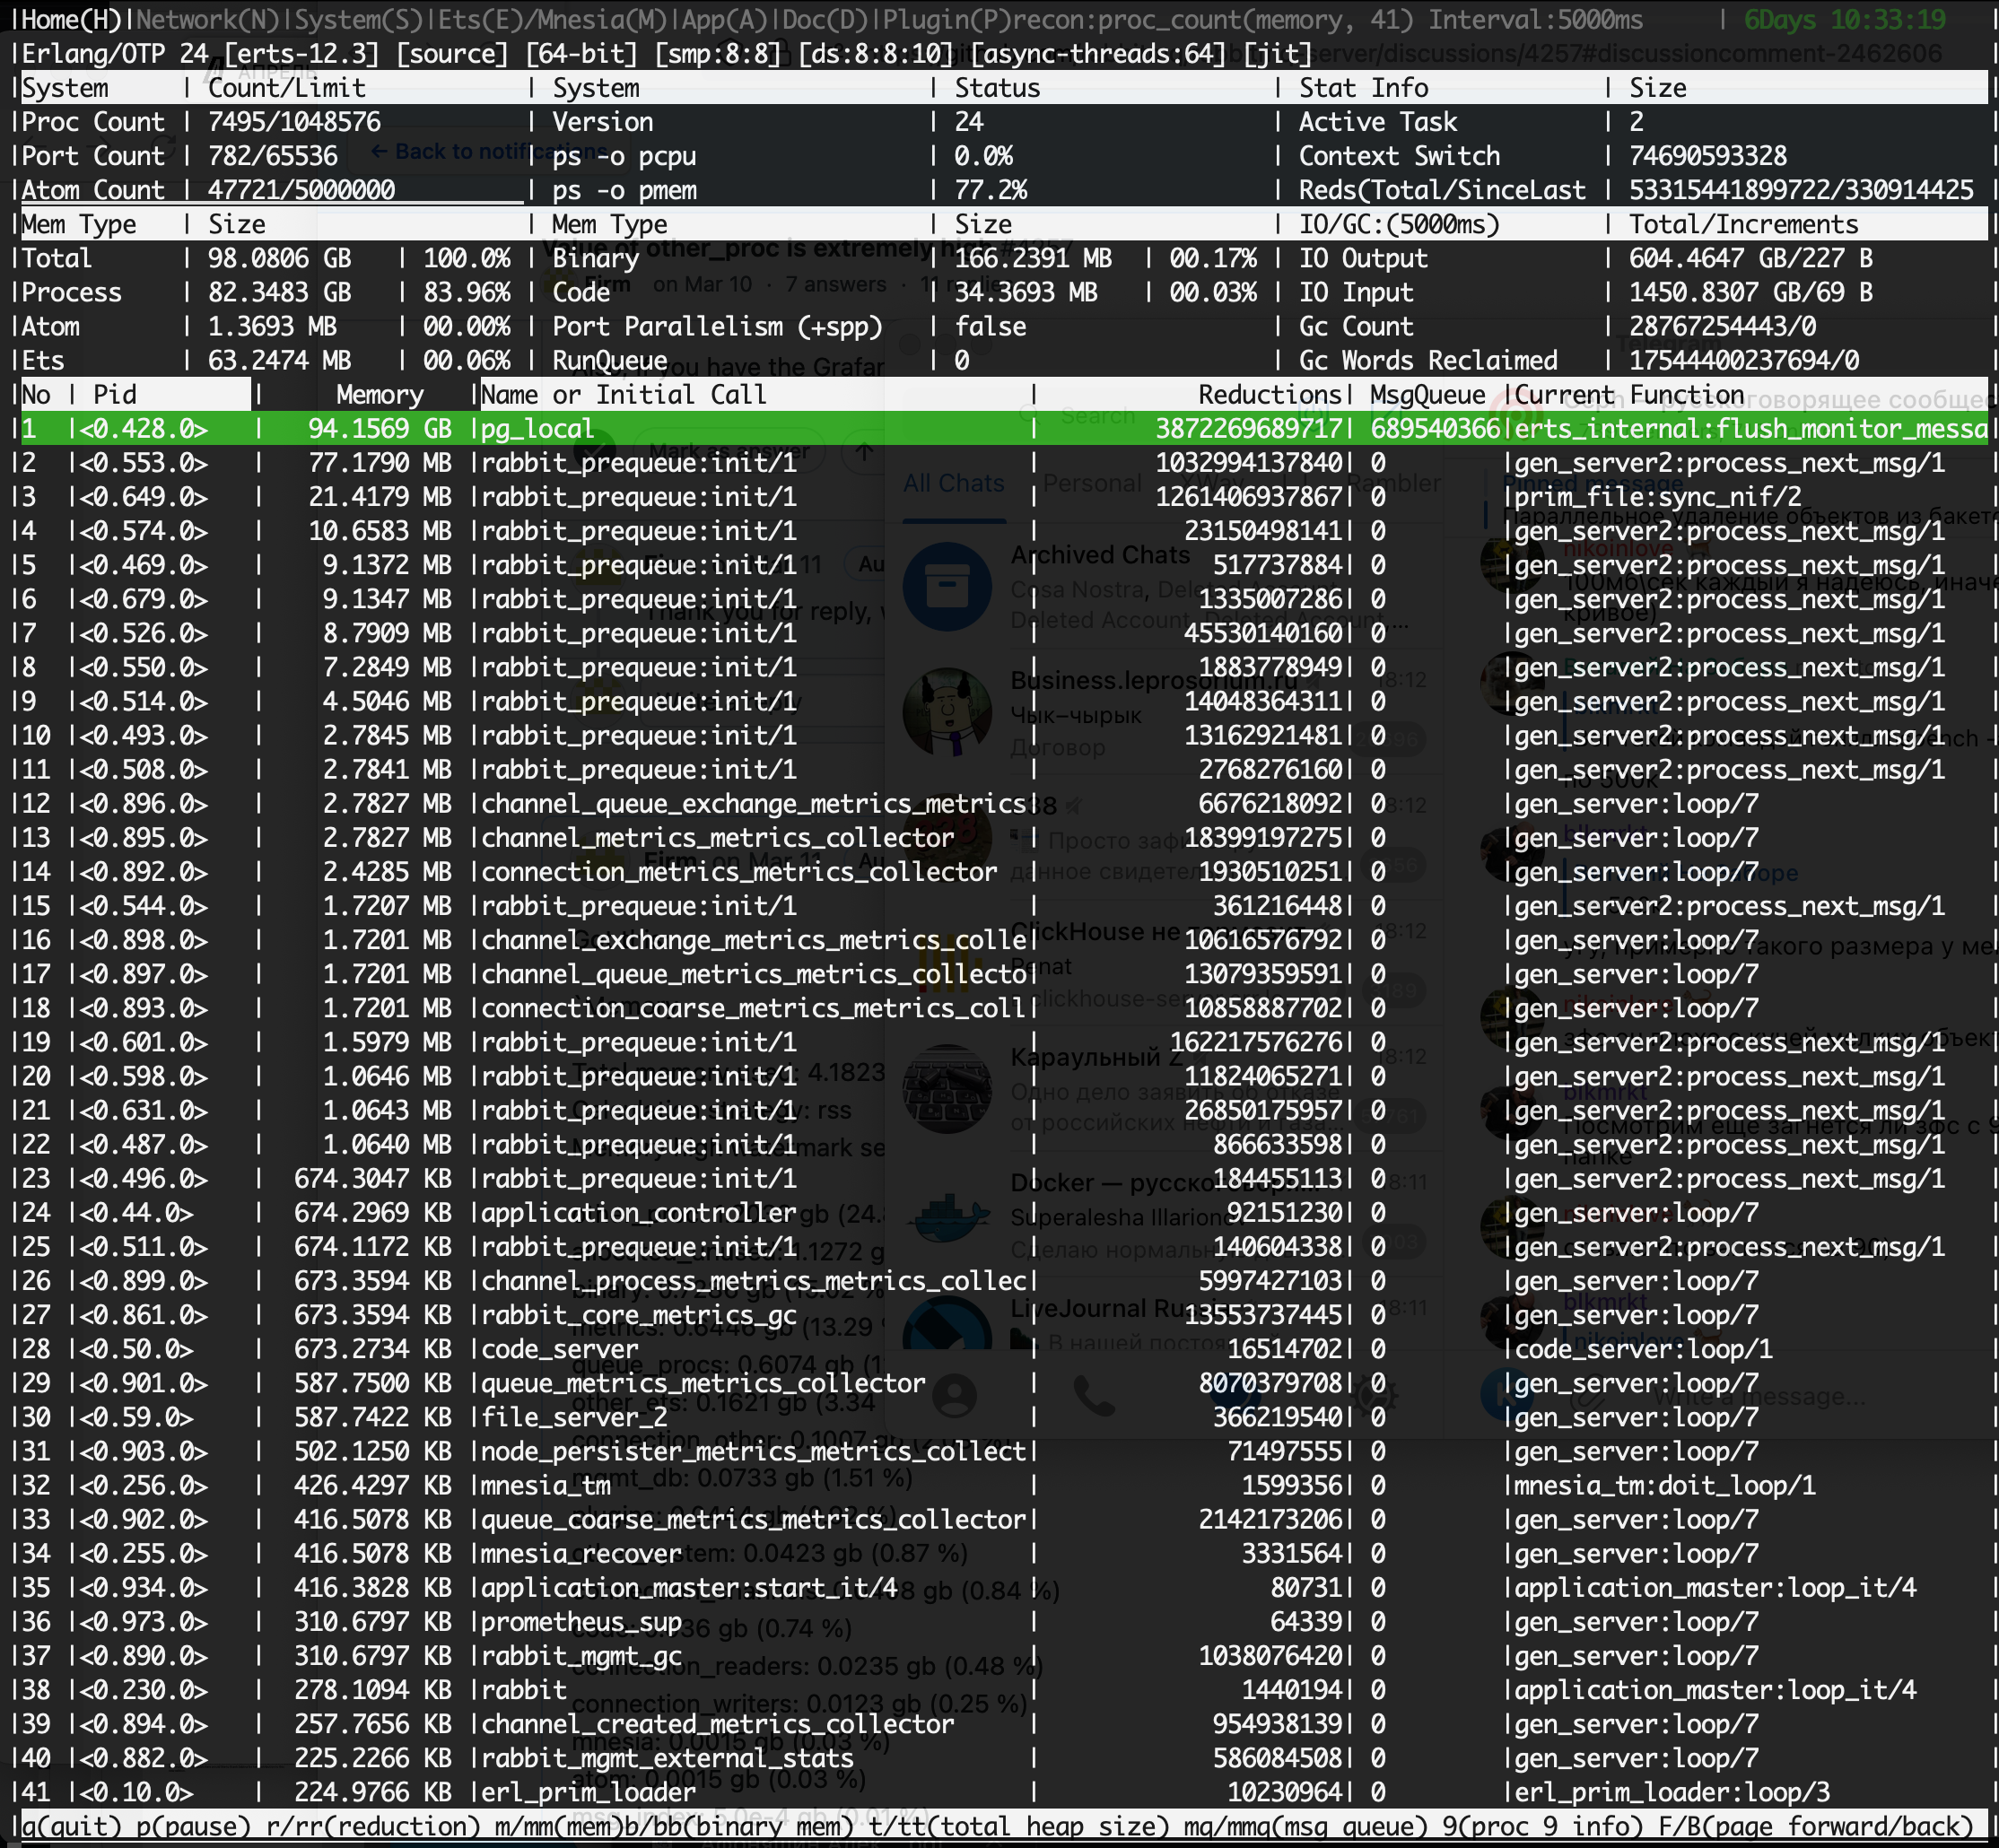
Another screenshot. 30 channels, 80 queues, around 40M messages total. |
Beta Was this translation helpful? Give feedback.
-
|
See #4257 (reply in thread). We cannot tell exactly what those processes are but it usually correlates with a very large number of channels. |
Beta Was this translation helpful? Give feedback.
-
|
rabbitmqctl eval 'recon:info(pg_local).' [{meta, |
Beta Was this translation helpful? Give feedback.
-
|
rabbitmqctl eval 'ets:info(pg_local_table, size).' |
Beta Was this translation helpful? Give feedback.
-
rabbitmqctl list_policies Listing policies for vhost "/" ... |
Beta Was this translation helpful? Give feedback.
-
|
@Firm we don't see much evidence of that, although it can be an extra factor that aggravates the issue. The actual root cause more often than not ends up being channel or queue churn. A lot of So look for churn that your applications create. |
Beta Was this translation helpful? Give feedback.
Uh oh!
There was an error while loading. Please reload this page.
-
Hi,
Running 3.9.13 version with 5-10K rps. Set watermarks both for memory (0.7) and disk. Having
other_procvalue more than 60-70% (of 72GB) I see unresponsive server process. How could I determine what eats memory? And how to fix that.Regards,
Beta Was this translation helpful? Give feedback.
All reactions