client connection drops and timeouts during rabbitmq_queue_messages_published_total statistic drop #4743
-
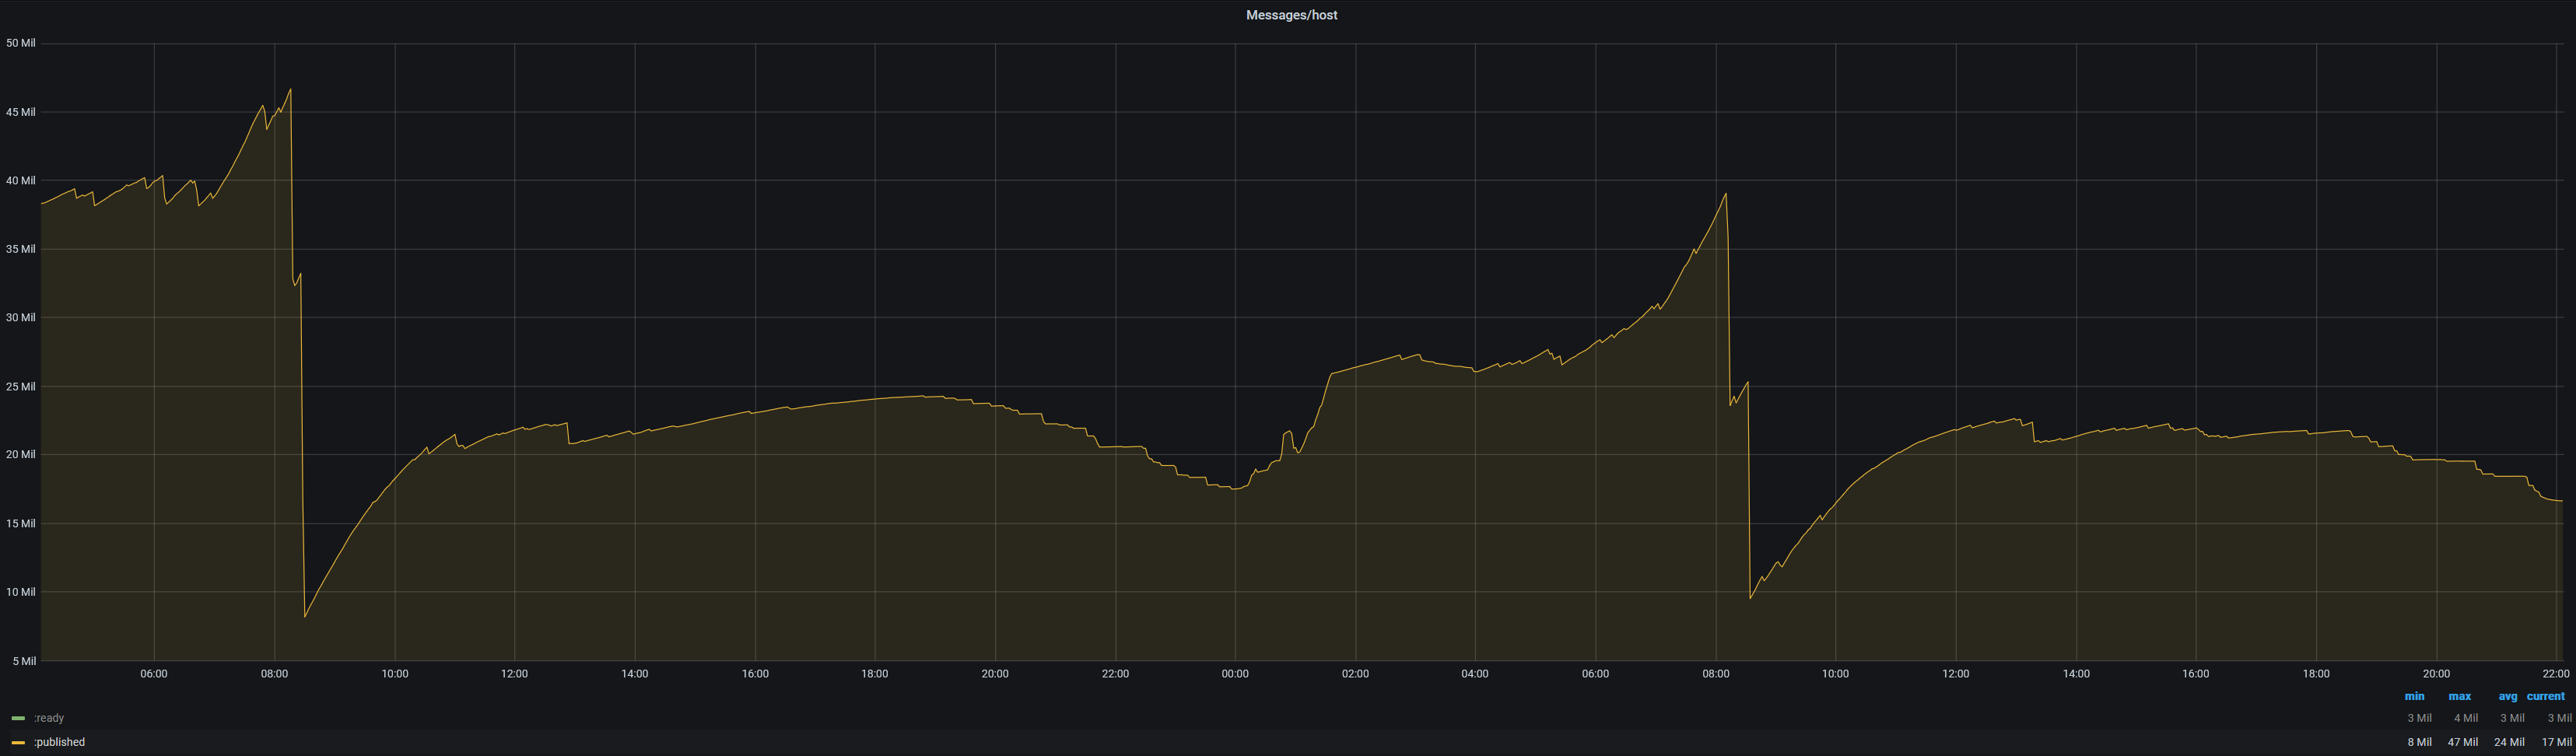
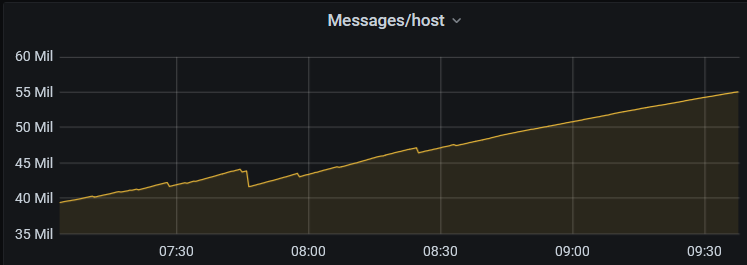
EnvironmentRabbitMQ: 3.19.13 Error descriptionWe are seeing peaks of send timeouts, connection drops and tls handshake timeouts sporadically but recurring for a short period of time. All cluster nodes within our cluster were affected independently from their load. Reproduction stepsUnknown. AnalysisWe analyzed this problem for several months not having a clue whats causing the issue except rabbitmq itself. BUT today we found out that these events EXACTLY correlate with massive drops in the
We don't know if this is the root cause or just another aspect of the problem. All other rabbitmq statistics seem to be normal before, during and after the event. We don't even understand why the @gerhard @michaelklishin Maybe you could give a hint what could cause such statistic drops, so we can dig deeper into the root cause. Thanks in advance and best regards |
Beta Was this translation helpful? Give feedback.
Replies: 3 comments 11 replies
-
|
Correlation does not mean causation. Metrics related to publishing will drop when a publishing rate drops, in particular, when publishing connections can no longer publish for any reason. No queues Both can easily have the same root cause: anything that prevents network activity on a connection The idea that a metric drop can lead to client connection closure seems a bit far fetched to me. |
Beta Was this translation helpful? Give feedback.
-
|
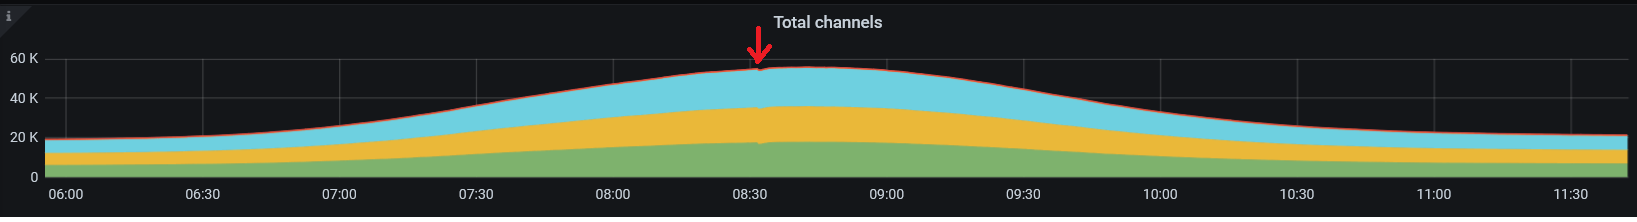
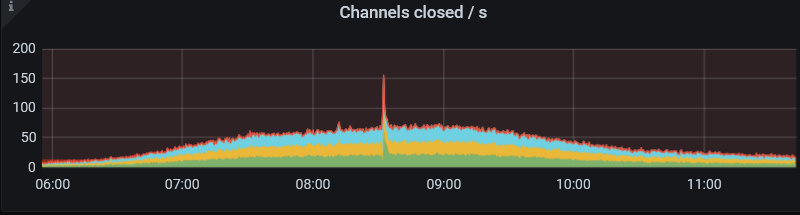
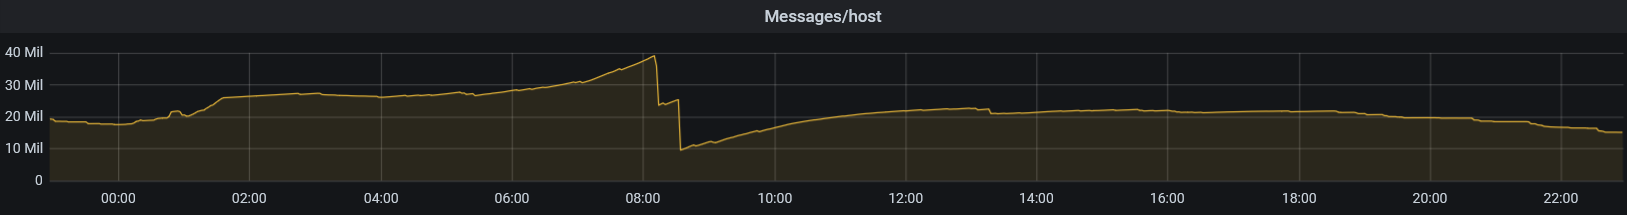
I really don't think that this is a causation. So - if I understand you right - you think that the dropped publishers are causing the statistics drop? But the connection drops are not in the same dimension: rabbitmq_channels: rabbitmq_connections_closed_total: rabbitmq_queue_messages_published_total: |
Beta Was this translation helpful? Give feedback.
-
|
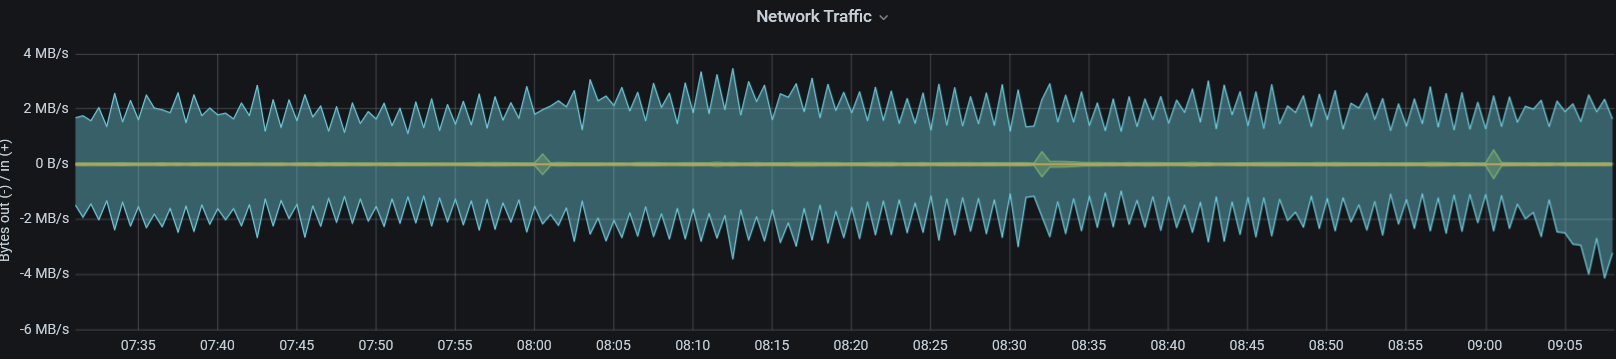
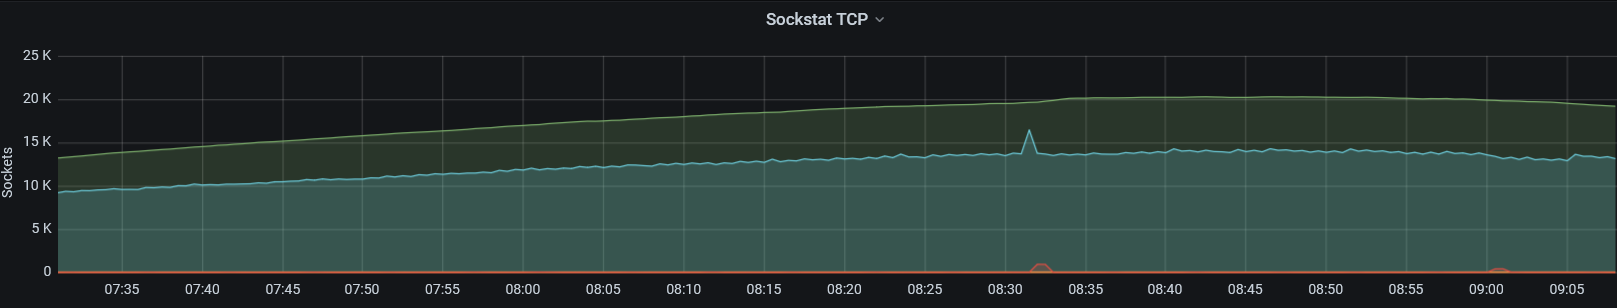
Concerning the network during this phase (1st cluster node): Traffic: Sockets: |
Beta Was this translation helpful? Give feedback.
-
|
Metric calculation is derivative from actual publisher activity and does not affect it. I don't see I can think of plenty of scenarios where something affects new and currently open publisher In fact, in applications with short lived publishers that churn through connections a lot it will be visible particularly quickly. |
Beta Was this translation helpful? Give feedback.
-
|
There is an uptick in the number of sockets used. If a RabbitMQ node, a proxy or something like that goes above the open file handle limit, no new connections will be accepted for a period of time. These are the things I'd look out for, starting with potential evidence in the logs. |
Beta Was this translation helpful? Give feedback.
-
|
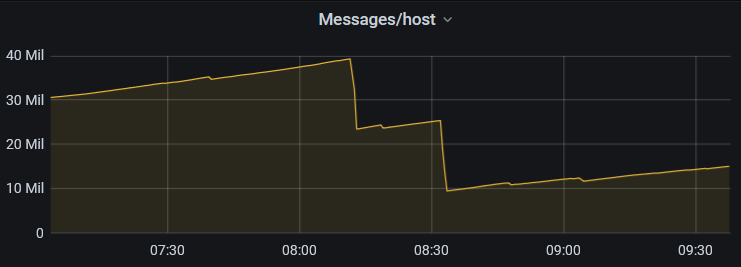
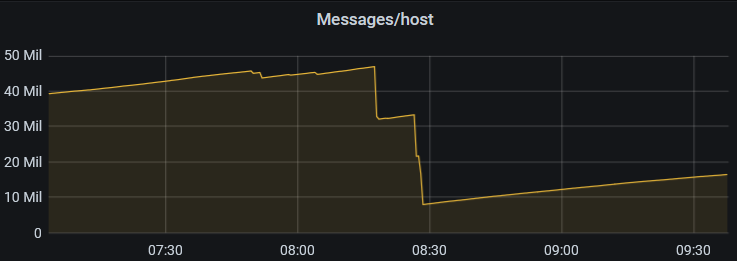
I understand and follow your reasoning. No causation - just a correlation - which might help to find the root cause. So just to understand this in detail. There's a drop of about 20 million published messages in the statistics (70% total).
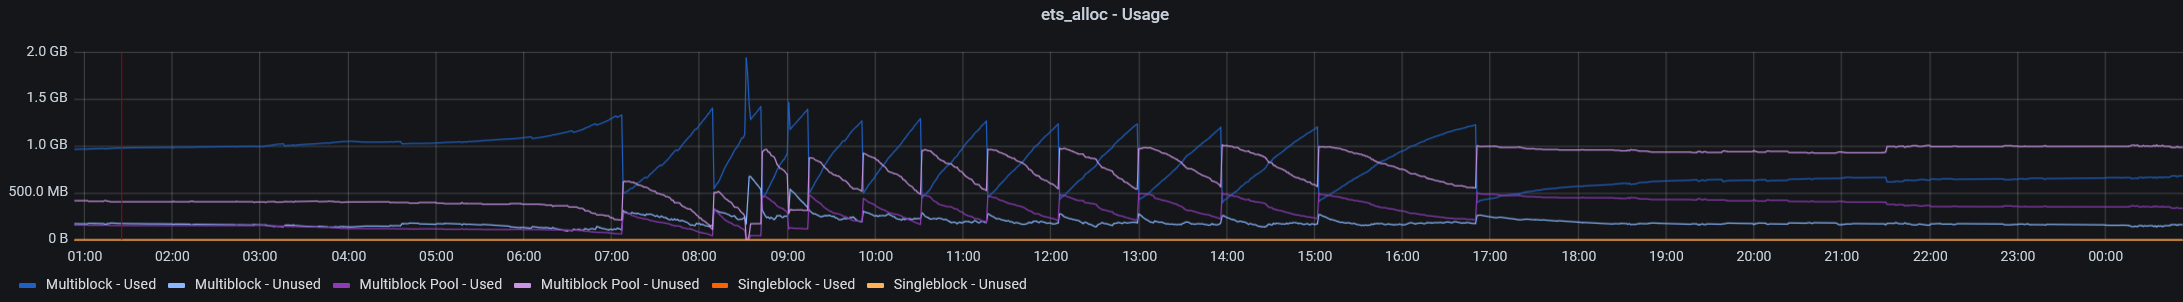
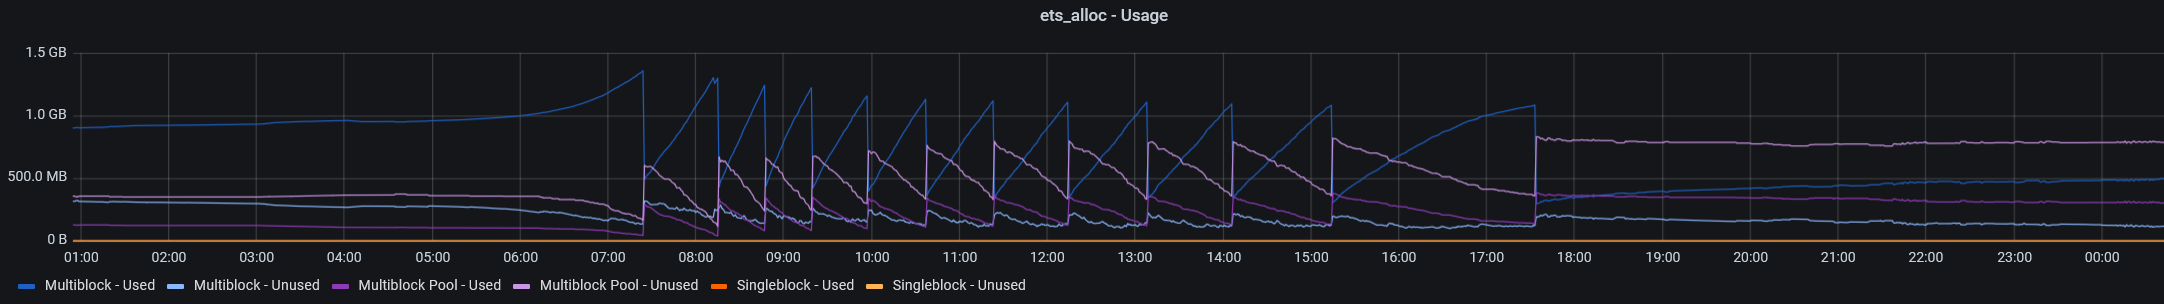
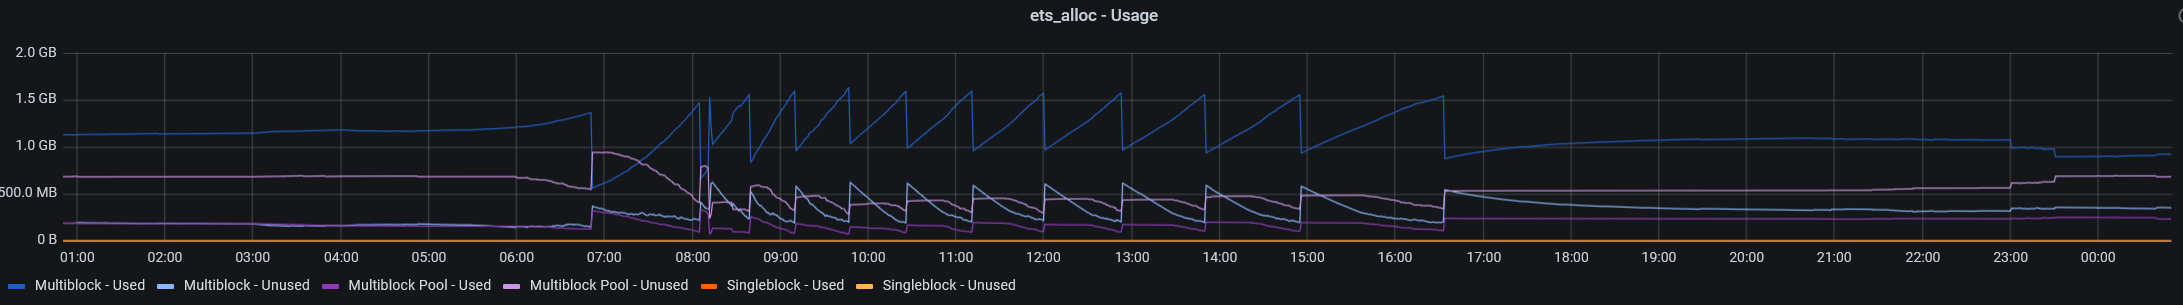
So I tried to find the erlang code which is resetting the metrics: Within the channel (isn't handle_consuming_queue_down_or_eol the consumer side?): And during a metric garbage collection event (every 2 minutes?) Because we are having a huge cluster with several thousand queues and bindings the garbage collection caught my attention. Taking a look at the ets allocations: 1st node (24h) 2nd node (24h) 3rd node (24h) There seems to be a magical limit for the ETS memory of about 1.5 GB which is hit 30 minutes before the "statistic events" are starting. But maybe just another correlating event. |
Beta Was this translation helpful? Give feedback.
-
|
Hello! Please provide the logs around the time of one of those events. |
Beta Was this translation helpful? Give feedback.
-
|
There is no such metric because there is no universally accepted definition of "an active publisher". The closest metric there is is connection egress data rate (outbound data rate) which for publishers will be constantly above a certain threshold. It won't be zero for consumers |
Beta Was this translation helpful? Give feedback.
-
|
@michaelklishin I expressed myself misleadingly: "100% connection churn in our hands" means throttling the consumer attaches. The IoT production scenario is much more complex. We have reproduced it in an isolated scenario. Reproduction steps:
Expected:Consumers are able to consume messages at a medium rate. Actual:Consumers are able to consume messages at about 2K msg/sec. The system load (1m) is at < 40%. On the other hand: Result:@michaelklishin So what we see is exactly what you predicted. Unfortunately there is no metric getting the total publisher count. Maybe that would have helped us to find the cause faster. Thanks very much for your support and keep up the good work. We are working on a solution where the connection churn is reduced to about less than 10-20 connections/sec having more cluster nodes and less missbehaving devices. Best regards |
Beta Was this translation helpful? Give feedback.
-
|
Thank you for reporting back. I see how a metric that indicates the number of publishers would help. Unfortunately for us, the definition of a "publisher" will vary from user to user. It's a function of a publishing rate, But we will discuss how this can be done with a few folks who are involved with RabbitMQ monitoring. |
Beta Was this translation helpful? Give feedback.
-
|
In my little clueless user/developer world I would have assumed exactly what the RabbitMQ docs are describing: https://www.rabbitmq.com/publishers.html#terminology "[...]In general in messaging a publisher (also called "producer") is an application (or application instance) that publishes (produces) messages.[...]" And yes. In my personal opinion 1 message a year is good enough to be considered a publisher as long as the channel isn't closed! :D |
Beta Was this translation helpful? Give feedback.
-
|
@motmot80 Hey. I'd like to investigate that scenario you provided but I'm missing some of the details. Could you provide full perf-test commands to publish and consume? The exact numbers (number of queues, msg/s, etc) usually need to be adjusted to trigger a given issue on a certain hardware, so I'd appreciate if you could provide all other details so that I don't end up with something significantly different than what you have. Do you mean something like this? I'm not sure about the publisher confirms, consumer acks, consumption rate ( |
Beta Was this translation helpful? Give feedback.
Correlation does not mean causation. Metrics related to publishing will drop when a publishing rate drops, in particular, when publishing connections can no longer publish for any reason. No queues
have to be deleted for that to happen.
Both can easily have the same root cause: anything that prevents network activity on a connection
(could be a resource alarm or anything around the infrastructure involved) will affect both clients
and metric values reported.
The idea that a metric drop can lead to client connection closure seems a bit far fetched to me.
It very likely works the other way around.