other_proc consumes 57% of memory on the node #5093
-
|
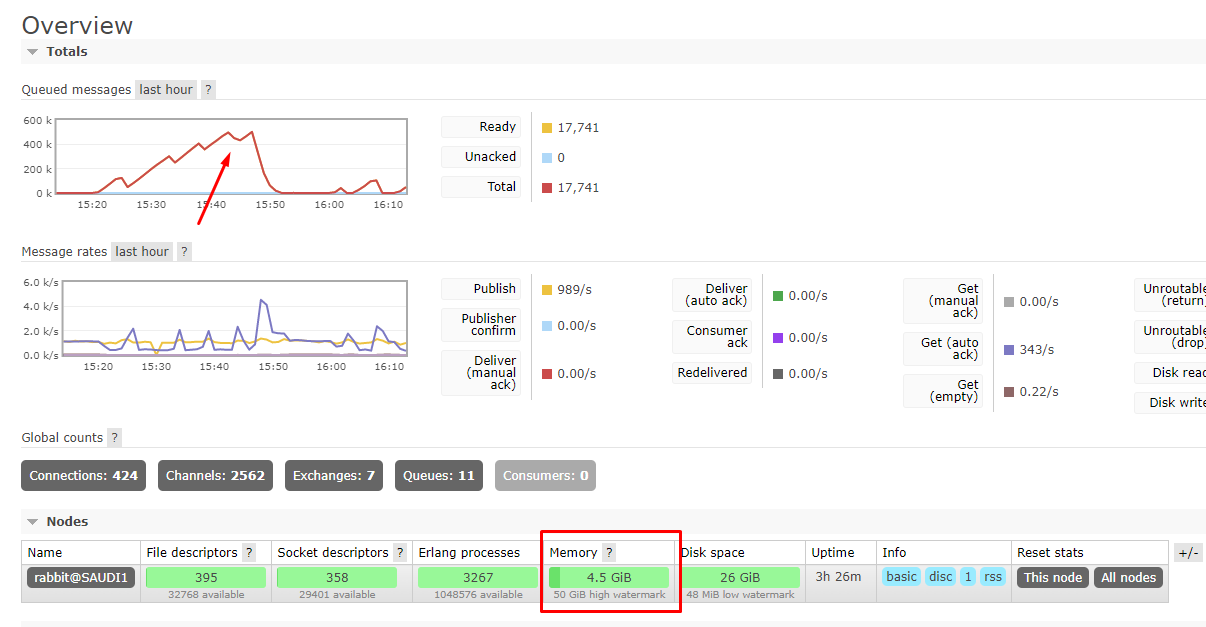
After start this metric always grow up to 20-30 Gb in one day. Until Rabbit became unusable. I see this other_proc eating the most amount of memory: It was on Rabbit MQ 3.9.X and Erlang 24 but after updating to RabbitMQ 3.10.5 and Erlang 25.0.2 still the same. RabbitMQ 3.10.5 |


Beta Was this translation helpful? Give feedback.
Replies: 6 comments 10 replies
-
|
There is no evidence of a memory leak. A Most likely this is a result of a few factors or some combination of them:
Increasing the number of CPU cores available to the node and reducing the churn applications produce |
Beta Was this translation helpful? Give feedback.
-
|
1 No problems with CPU By the way, I have server with less powerfull hardware and with the same load but RabbitMQ 3.6.15 and Erlang R16B03-1 and this Rabbit have uptime 312 days and spend only 1 Gb and no freezes at all. |


Beta Was this translation helpful? Give feedback.
-
|
Could you try to simulate your workload using https://perftest.rabbitmq.com/? That would allow us to run the tests and hopefully optimize some stuff. |
Beta Was this translation helpful? Give feedback.
-
|
It's not the number of entities (connections or queues) that's important here. It's the number of internally emitted events, which is RabbitMQ 3.6 had few types of events, so high churn probably did not affect it as much. For example, it did not have an event for failed authentication attempts. Do that 10K times a second and the Logs and churn metrics available via the management UI and Prometheus/Grafana will help narrow things down. I doubt this can be reproduced with PerfTest because it's not the message rates that are important here. Something heavily floods |
Beta Was this translation helpful? Give feedback.
-
|
Is any method to clean this backlog "on the fly" ? Or may be settings to not generate? Because this is not the thing I want from Rabbit. I only want it to fast receive messages and fast pass on. And memory only for storing messages not for some unknown events. |
Beta Was this translation helpful? Give feedback.
-
|
For now only the way I see is to setup old version of RabbitMQ or reboot Rabbit every 2-3 hours :-) But this is very funny sulution. |
Beta Was this translation helpful? Give feedback.
-
|
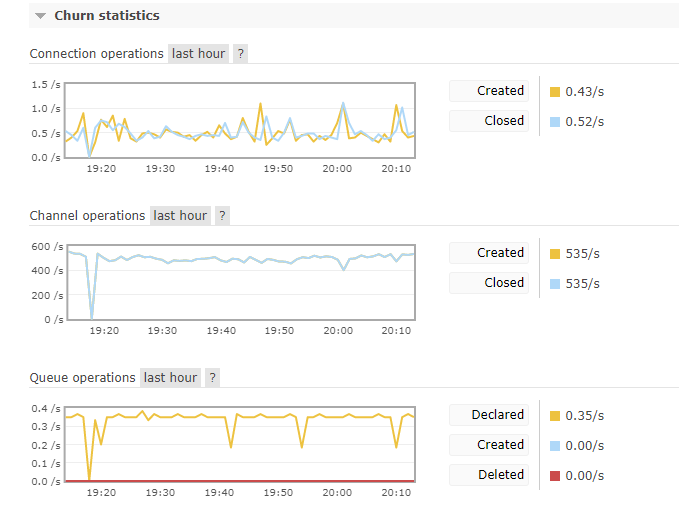
This is my Churn statistics. Channel operations too high? |
Beta Was this translation helpful? Give feedback.
-
|
Yes, far too many channel operations. |
Beta Was this translation helpful? Give feedback.
-
|
May be I do something wrong on client side? |
Beta Was this translation helpful? Give feedback.
-
|
It looks like you're using PHP. I suggest using this proxy: https://github.com/cloudamqp/amqproxy |
Beta Was this translation helpful? Give feedback.
-
|
Great! Thank you for letting us know. I'm assuming this fixed the memory use issue as well. |
Beta Was this translation helpful? Give feedback.
-
|
Yup, that must have eliminated the connection churn and thus relieved |
Beta Was this translation helpful? Give feedback.
-
|
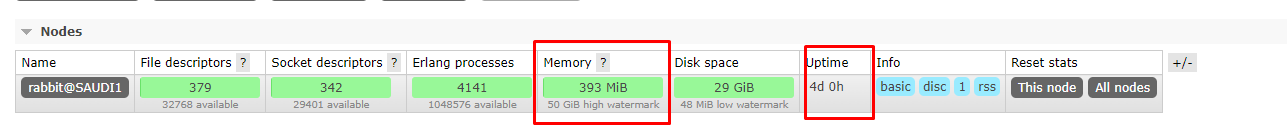
Yes, memory issue gone: But really want to know is the any hope to remove this issue without using additional service as proxy? May be some settings? |
Beta Was this translation helpful? Give feedback.
-
|
You don't need to introduce proxies, if your applications can maintain a long-lived connection. Connection churn is always an anti-pattern, not just for RabbitMQ. Having said that, we are aware of at least one thing that makes this particularly bad right now and we are going to either improve it, or disable the feature that causes this by default (connection tracking for the purpose of per-user/per-vhost limits; currently it's always enabled). Also, the whole backend for how we store this information is going to be replaced in the future (Khepri will replace Mnesia), which will completely change how storing this information is handled. |
Beta Was this translation helpful? Give feedback.
-
|
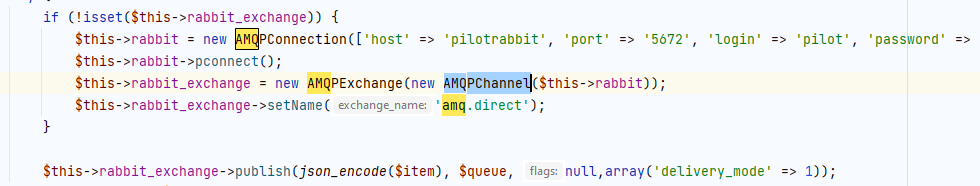
I cannot change this logic (lot of reconnects) because I use it from php via nginx+php-fpm. But using pconnect instead of connect allows me to reuse connections, but I have to recreate channels and this was issue. In older versions of RabbitMQ this architecture was without any leaks and issues. |
Beta Was this translation helpful? Give feedback.
It looks like you're using PHP. I suggest using this proxy: https://github.com/cloudamqp/amqproxy