2022/02/maps-in-r/ #57
Replies: 4 comments 12 replies
-
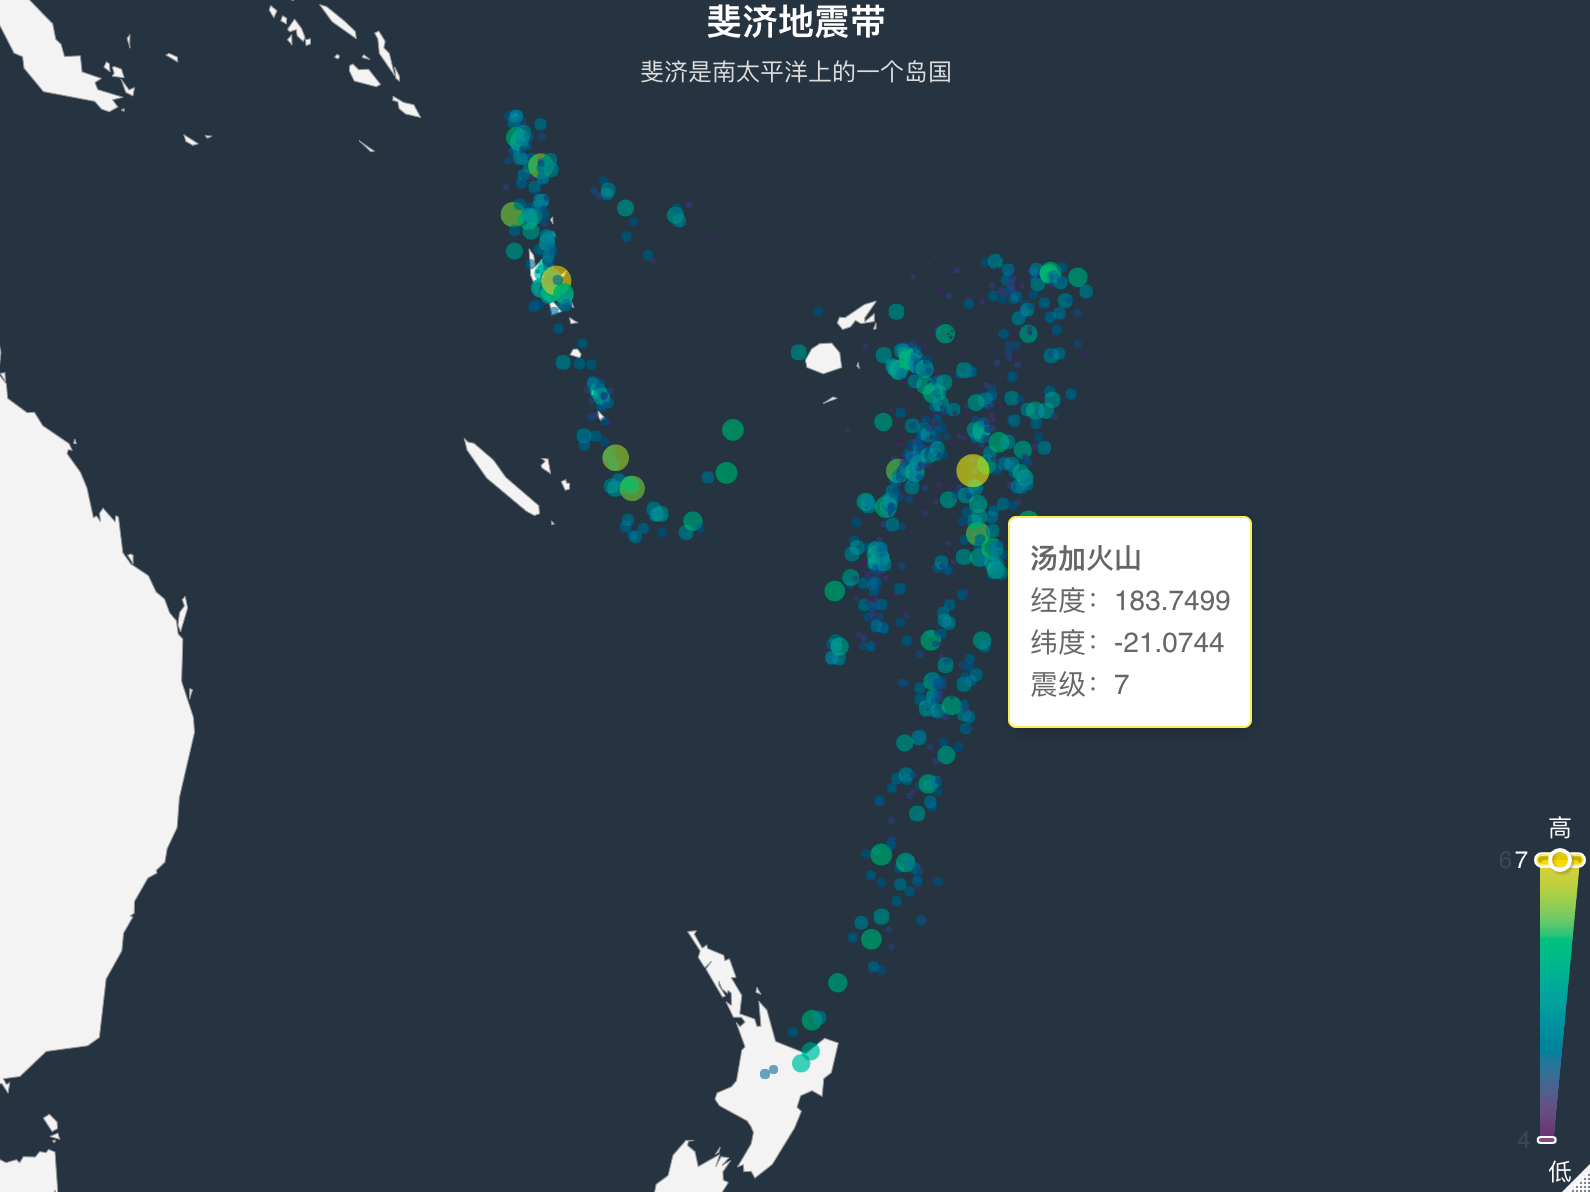
斐济地震带添加汤加火山位置echarts4r 包提供 library(echarts4r)
# 汤加火山位置
tonga <- data.frame(long = 183.7499, lat = -21.0744, mag = 7, name = "汤加火山")
# 绘图
quakes |>
e_charts(x = long) |>
e_geo(
roam = TRUE,
map = "world",
boundingCoords = list(
c(165.67, -38.59),
c(188.13, -10.72)
)
) |>
e_scatter(
serie = lat,
scale = NULL, # 去掉尺度变换
size = mag,
name = "地震点",
coord_system = "geo"
) |>
e_visual_map(
serie = mag, # 震级图例
right = 0, bottom = 0, # 图例的位置,离容器右侧和下侧的距离
text = c("高", "低"), # 定义两端的文本
textStyle = list(color = "white"),
inRange = list(
color = hcl.colors(10), # 填充颜色
colorAlpha = 0.7, # 设置透明度
symbolSize = c(1, 15) # 设置气泡大小
)
) |>
e_labels(
position = "top",
formatter = htmlwidgets::JS("function(params){return( params.name )}")
) |>
e_tooltip(
formatter = htmlwidgets::JS("
function(params) {
return('<strong>' + params.seriesName + '</strong>' +
'<br>经度:' + params.value[0] +
'<br>纬度:' + params.value[1] +
'<br>震级:' + params.value[2])
}
")
) |>
e_title(
text = "斐济地震带",
subtext = "斐济是南太平洋上的一个岛国",
left = "center",
sublink = "https://echarts4r.john-coene.com/"
) |>
e_legend(show = FALSE) |> # 隐藏图例
e_theme(name = "chalk") |>
e_data(tonga, x = long) |>
e_scatter(
serie = lat, name = "汤加火山",
scale = NULL, size = mag, coord_system = "geo"
) |
Beta Was this translation helpful? Give feedback.
-
效果图相比于原文极大的减少了数据操作和代码量,预览图如下
|
Beta Was this translation helpful? Give feedback.
-
|
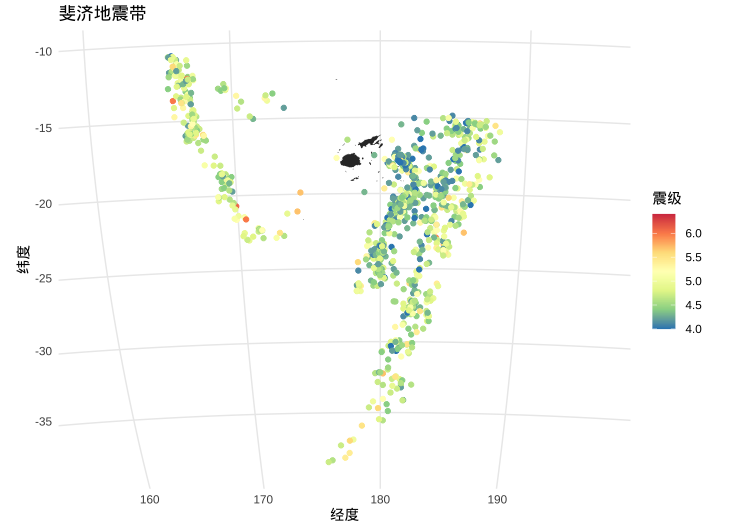
竟然忘了补充 ggplot2 版的散点图,我当时是有多喜欢 lattice 呀!不过,ggplot2 也是太不稳定了, library(maps)
library(mapdata)
library(ggplot2)
showtext::showtext_auto()
FijiMap <- map_data("worldHires", region = "Fiji")
ggplot(FijiMap, aes(x = long, y = lat)) +
geom_map(map = FijiMap, aes(map_id = region), linewidth = .2) +
geom_point(data = quakes, aes(x = long, y = lat, colour = mag)) +
scale_colour_distiller(palette = "Spectral") +
scale_y_continuous(breaks = 5 * -9:-1) +
coord_map("ortho", orientation = c(-10, 180, 0), xlim = c(160, 195)) +
labs(colour = "震级", x = "经度", y = "纬度", title = "斐济地震带") +
theme_minimal()
|
Beta Was this translation helpful? Give feedback.
-
|
我想用 echarts4r 绘制纽约市的地图散点图,我拿到的数据结构长下面这样,里面有纽约市各交叉路口的经纬度,记得以前绘制中国城市地图是在高德上面下载了.json 文件后导入的,但是美国纽约市的类似的.json 文件我还没找到,这块我太生疏了,湘云你知道吗?
|
Beta Was this translation helpful? Give feedback.
-
|
@XiangyunHuang 民大丰台校区确实很偏,到海淀也要两个半小时,而且听说 27 年才通地铁。不过我觉得还是可以接受的,因为如果再次回到过去,我怎样都会选择人类学或民族学,而这两个专业都会要求花上差不多一年时间做田野和写毕业论文,剩下的时间再用来熟悉校园生活和看书学习,然后就差不多毕业啦。另外,民大是我了解到的最可接近(合适)且最理想的选择,是我认为的自己最有希望能考上的 985,虽然地理位置有些出乎意料哈哈,不过我可以随时在空闲时间往学院路这些地方跑,哪怕去不同的高校(清华、北大、人大等)看看,也很难得嘞。还记得念大二还是大三那年,我们学院组织了一个去武汉大学的访学团,大家都很期待,觉得如此难得(但我没被选上),如今我却有了可以随时溜进清北人大晃悠的机会,这可更是一笔丰厚的财富。 最后想想,你在北京的经历应当是唤起我自身在内心本就憧憬的事物:可能性。所以并没有误导一说,你的经历仅属于你,我无法也不会去复刻,但它确实在一定程度上激励了我,让我对北京有好感。不过更重要的是,我认为,在我看到你的博文以前,我一直在追寻可能性,恰好在之后的旅途中,我看见师姐通过自己的努力考进了民大,看见你讲述在北京求学的心得和收获——我追求的可能性恰好以这些方式向我呈现。或者说,我是怀揣着答案向前走。总之嘞,想想四年在广州,两年在北京,人就活一世,我觉得这对于出身小县城的我来说,我的求学生涯老挣了。 |
Beta Was this translation helpful? Give feedback.
-
@earfanfan 袁凡,感觉好像也没怎么看过你在博客里写读研时的经历、生活和想法啥的,挺好奇你当时是咋过的,之前问你,你喊了湘云来分享,湘云说主要在学 R,我还猜你当时是不是也主要在学习统计。 |
Beta Was this translation helpful? Give feedback.
-
|
@residualsun1 我很赞同你说的,加油吧! |
Beta Was this translation helpful? Give feedback.
-
|
你小子啊,我本硕都是统计学专业的,本科学的数理统计,研究生学的经济统计,读研的时候确实在学 R,博客里没写是因为无法面对过去,所以有很多年的时间对于现在的我来说就是刻意的空白了。 我最近看了两篇关于 AI 的文章,分享在这里,如何在 AI 时代避免技能退化、三水的大语言模型坤年记。 昨天我们同事还在讨论:AI 时代还需要关注框架底层实现逻辑和设计模式吗? 由于2.5年的时间里 AI 领域已经走过几个时代,我的一些看法也变了,产生了许许多多的“没想到”。记得以前还来湘云这里讨论过一些呢。 |
Beta Was this translation helpful? Give feedback.
-
好吧。虽然不知道过去的那些时间发生了什么,但我认为现在的你正在努力且用心地过好着当下的生活,其实这样就很好很好。
我对 AI 还没有什么概念。 |
Beta Was this translation helpful? Give feedback.
Uh oh!
There was an error while loading. Please reload this page.
-
空间数据可视化与 R 语言(上篇) - Xiangyun Huang
https://xiangyun.rbind.io/2022/02/maps-in-r/
Beta Was this translation helpful? Give feedback.
All reactions