How to integrate Prometheus in Remix app? #4479
Replies: 2 comments
-
|
This past week, I integrated prometheus with my Remix app which is using the express template. Remix Express TemplateThe reason I've opted to use the Express template instead of the Remix App Server template is because you get access to the I ended up using the express-prom-bundle package. It seemed like the most up to date related middleware package and it offered lots of configurable options, This is what my server.js file looks like with the middleware applied: server.js code// server.js
const { join } = require("path");
const { readFileSync } = require("fs");
const { createServer } = require("https");
const path = require("path");
const express = require("express");
const compression = require("compression");
const morgan = require("morgan");
const { createRequestHandler } = require("@remix-run/express");
const { cwd } = require("process");
const promBundle = require("express-prom-bundle");
const { collectDefaultMetrics } = require("prom-client");
require("dotenv").config();
const BUILD_DIR = path.join(process.cwd(), "build");
const app = express();
app.use(compression());
const CWD = cwd();
const httpsCert = {
// Pull key and cert from sdi-infra-fe-remix/var folder
key: readFileSync(join(CWD, "var/identity.key")),
cert: readFileSync(join(CWD, "var/identity.cert")),
ca: readFileSync("/etc/riddler/ca-bundle.crt"),
requestCert: true,
rejectUnauthorized: false,
};
// Remix fingerprints its assets so we can cache forever.
app.use("/build", express.static("public/build", { immutable: true, maxAge: "1y" }));
// Everything else (like favicon.ico) is cached for an hour. You may want to be more aggressive with this caching.
app.use(express.static("public", { maxAge: "1h" }));
app.use(morgan("tiny"));
/**
* Register middleware to collect default metrics (Ex:cpu, memory, event loop lag etc)
* and monitor all API endpoints in app
*
* @example
* https://github.com/jochen-schweizer/express-prom-bundle#other-options
* https://github.com/siimon/prom-client#default-metrics
*/
const prometheusMetricsMiddleware = promBundle({
includeMethod: true,
includePath: true,
includeStatusCode: true,
promClient: {
collectDefaultMetrics
},
/**
* @description
* For URL paths that have dynamic values in them, normalize the URLs so they show up in grafana/prometheus as one path.
* NOTE: anytime we add a new path in the app that contains a dynamic segment, we need to update the list below.
*/
normalizePath: [
// ---------- Netgraph Paths ----------------------
['^/api/v1/graphQL.*', '/api/v1/graphQL'],
// ---------- StateDB Paths ----------------------
['^/api/v1/app1/getSystems.*', '/api/v1/app1/getSystems'],
['^/api/v1/app1/device/.*', '/api/v1/app1/device/#value'],
['^/api/v1/app1/getStateDBSearch.*', '/api/v1/app1/getStateDBSearch'],
['^/api/v1/app1/getBgp.*', '/api/v1/app1/getBgp'],
['^/api/v1/app1/getInterfaces.*', '/api/v1/app1/getInterfaces'],
['^/api/v1/app1/getNeighbors.*', '/api/v1/app1/getNeighbors'],
['^/api/v1/app1/getInventory.*', '/api/v1/app1/getInventory'],
// ---------- NAT Management Paths ---------------
// ..........................
],
});
app.use(prometheusMetricsMiddleware)
/**
* @description
* This endpoint will be scraped by prometheus. Later the prometheus data will be surfaced in our grafana dashboards automatically.
* Normally we would manually register this endpoint below, however the `express-prom-bundle` package registers one for our app automatically.
*/
// app.get('/metrics', async (req, res) => {})
app.all(
"*",
process.env.NODE_ENV === "development"
? (req, res, next) => {
purgeRequireCache();
return createRequestHandler({
build: require(BUILD_DIR),
mode: process.env.NODE_ENV,
})(req, res, next);
}
: createRequestHandler({
build: require(BUILD_DIR),
mode: process.env.NODE_ENV,
})
);
const port = process.env.PORT || 18396;
const httpsServer = createServer(httpsCert, app).listen(port, () => {
console.log(`Express server listening on https://localhost:${port}`);
});
function purgeRequireCache() {
// purge require cache on requests for "server side HMR" this won't let
// you have in-memory objects between requests in development,
// alternatively you can set up nodemon/pm2-dev to restart the server on
// file changes, but then you'll have to reconnect to databases/etc on each
// change. We prefer the DX of this, so we've included it for you by default
for (const key in require.cache) {
if (key.startsWith(BUILD_DIR)) {
delete require.cache[key];
}
}
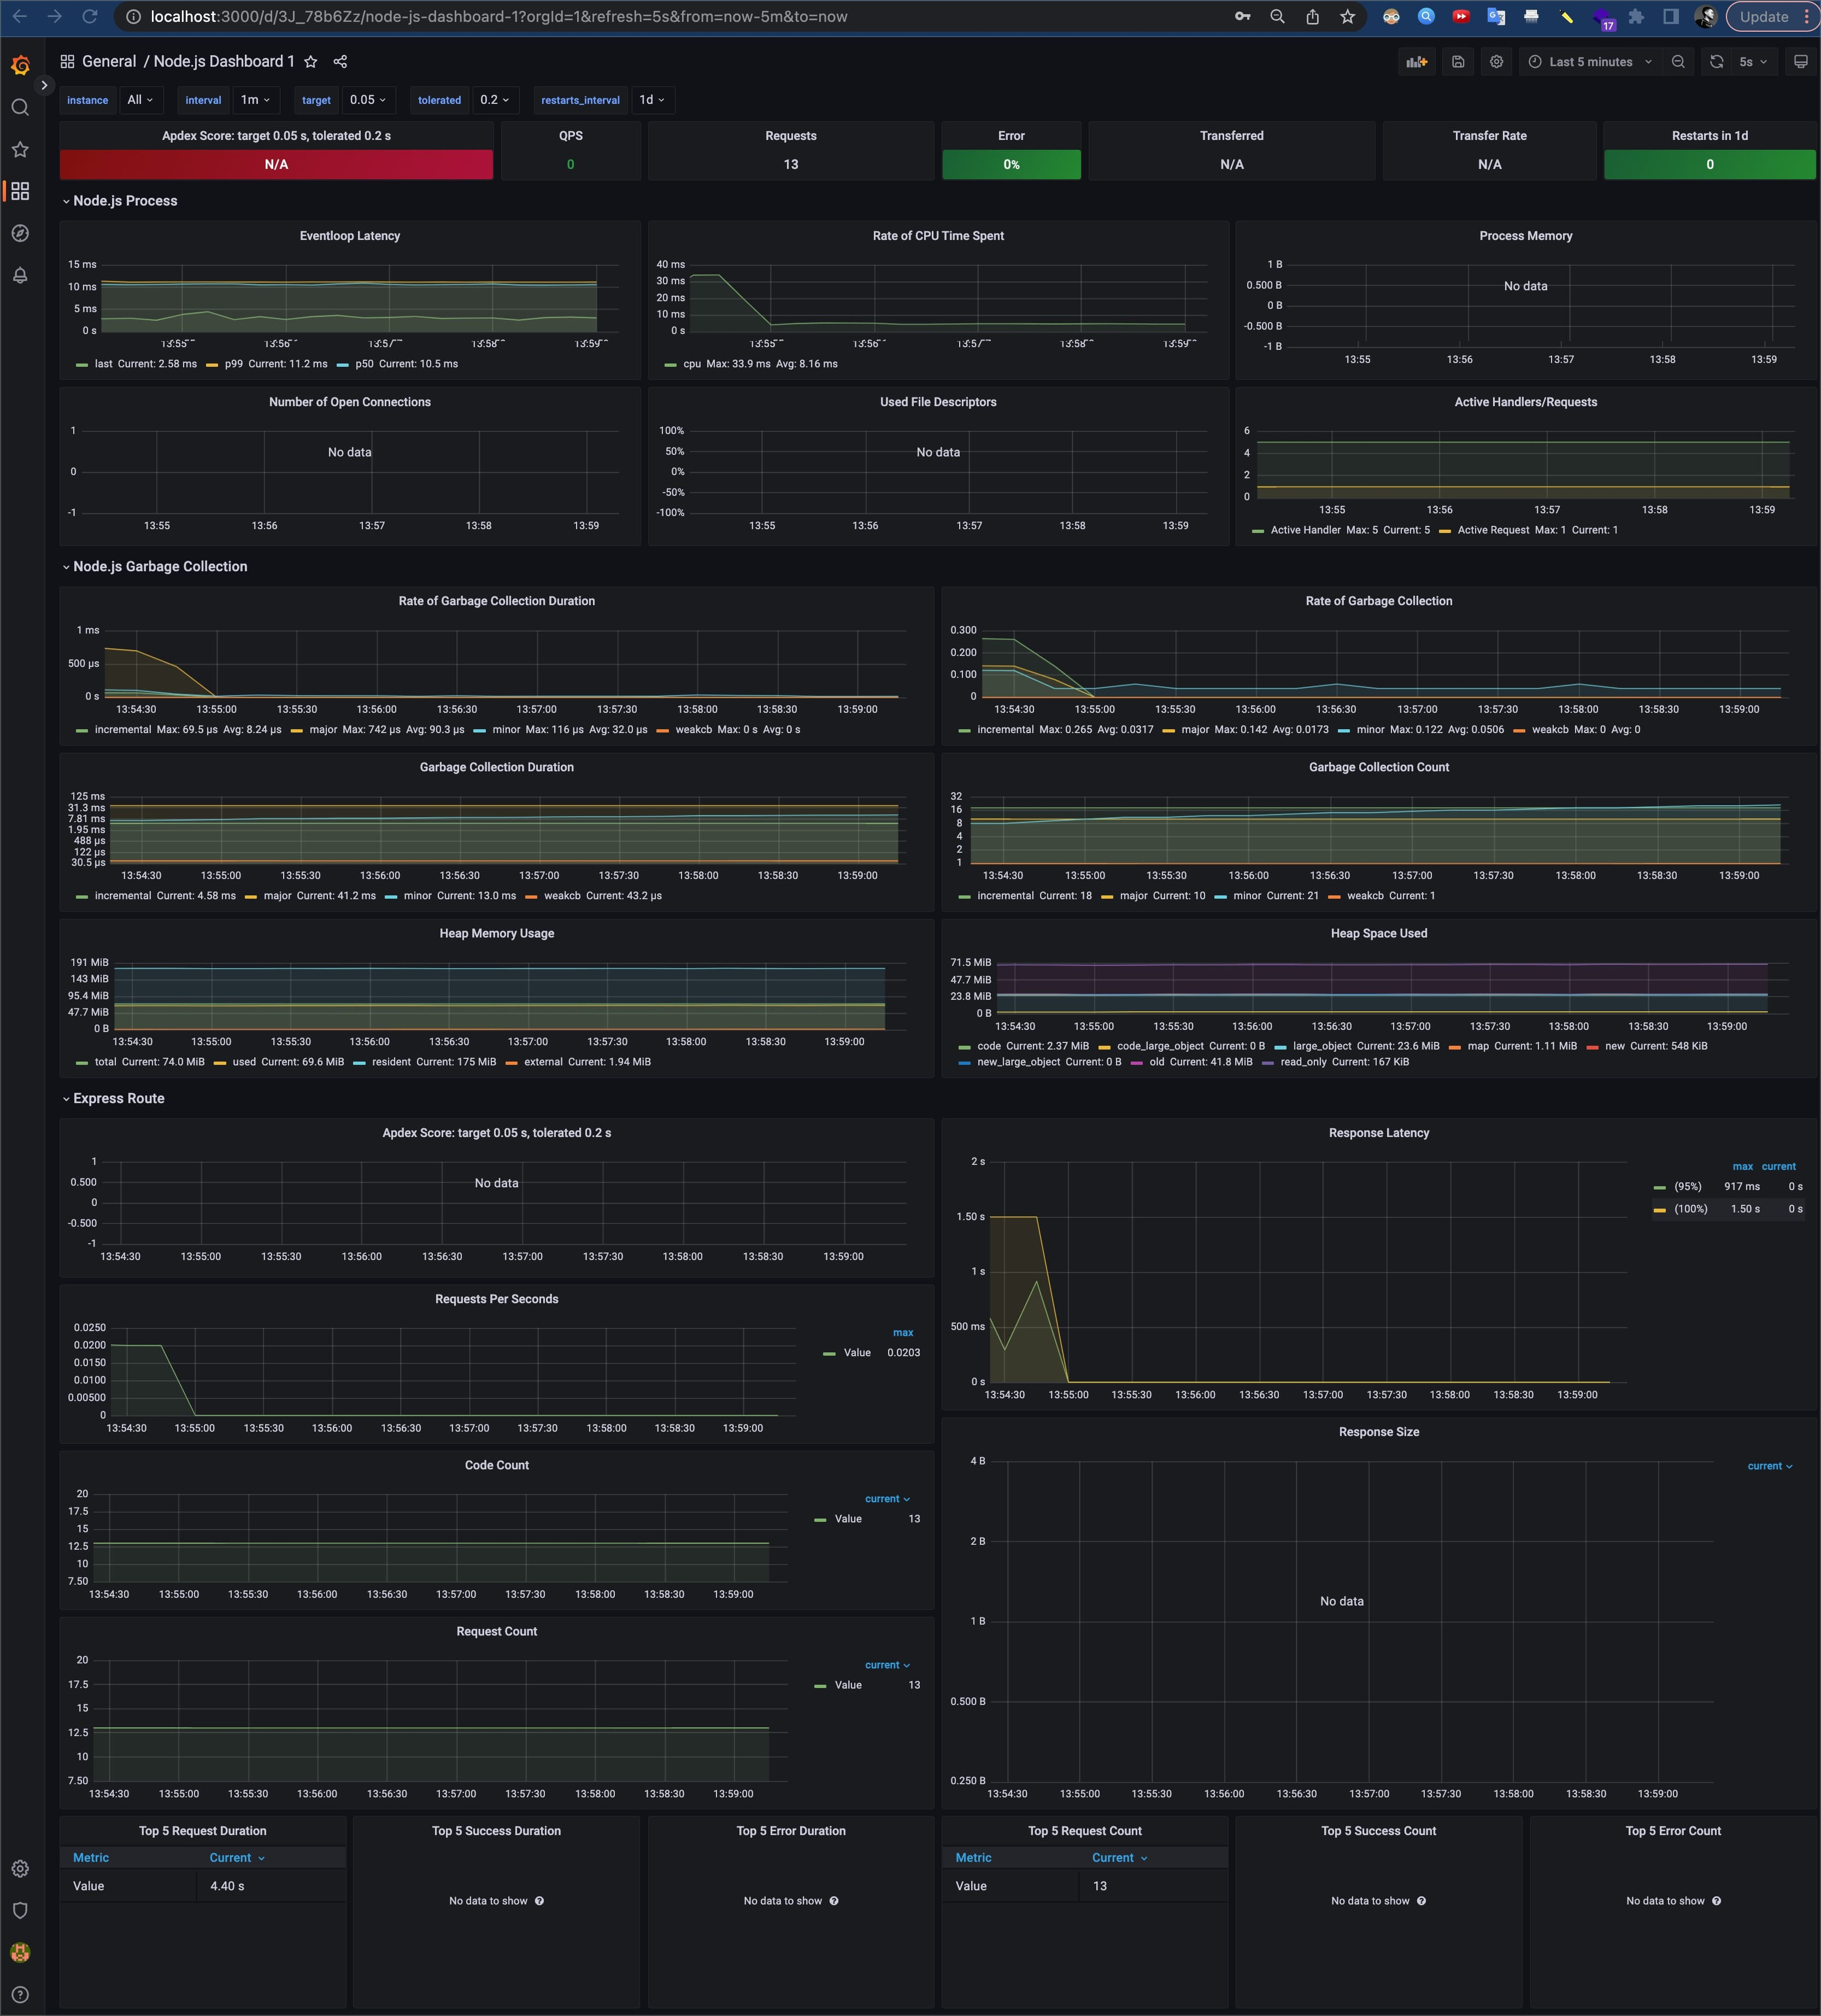
}I ended up using this dashboard template: https://grafana.com/grafana/dashboards/12230-node-js-dashboard/
🟡 NOTE: References |
Beta Was this translation helpful? Give feedback.
-
|
Panel JSON {
"datasource": {
"type": "prometheus",
"uid": "af0f87ab-18a8-4059-89c7-58472fd470b3"
},
"targets": [
{
"refId": "A",
"expr": "count by(method, status_code) (http_request_duration_seconds_bucket)",
"range": true,
"instant": true,
"datasource": {
"type": "prometheus",
"uid": "af0f87ab-18a8-4059-89c7-58472fd470b3"
},
"editorMode": "builder",
"legendFormat": "__auto",
"useBackend": false,
"disableTextWrap": false,
"fullMetaSearch": false,
"includeNullMetadata": false
}
],
"type": "timeseries",
"title": "New Panel",
"gridPos": {
"x": 0,
"y": 0,
"w": 14,
"h": 10
},
"transformations": [],
"options": {
"tooltip": {
"mode": "single",
"sort": "none"
},
"legend": {
"showLegend": true,
"displayMode": "list",
"placement": "bottom",
"calcs": []
}
},
"fieldConfig": {
"defaults": {
"custom": {
"drawStyle": "line",
"lineInterpolation": "linear",
"barAlignment": 0,
"lineWidth": 1,
"fillOpacity": 0,
"gradientMode": "none",
"spanNulls": false,
"insertNulls": false,
"showPoints": "auto",
"pointSize": 5,
"stacking": {
"mode": "none",
"group": "A"
},
"axisPlacement": "auto",
"axisLabel": "",
"axisColorMode": "text",
"axisBorderShow": false,
"scaleDistribution": {
"type": "linear"
},
"axisCenteredZero": false,
"hideFrom": {
"tooltip": false,
"viz": false,
"legend": false
},
"thresholdsStyle": {
"mode": "off"
}
},
"unitScale": true,
"color": {
"mode": "palette-classic"
},
"mappings": [],
"thresholds": {
"mode": "absolute",
"steps": [
{
"value": null,
"color": "green"
},
{
"value": 80,
"color": "red"
}
]
}
},
"overrides": []
},
"id": 97
} |

Beta Was this translation helpful? Give feedback.
Uh oh!
There was an error while loading. Please reload this page.
-
Scenario: I'd like to integrate prometheus in my Remix app so I can monitor specific aspects of my app such as:
How would I do this with a Remix app?
Beta Was this translation helpful? Give feedback.
All reactions