-
Notifications
You must be signed in to change notification settings - Fork 31
Rperform: Performance analysis and visualization for R
There exists various tools and software to help developers across different languages test the performance of their code. This analysis can be performed in terms of quantifiable metrics such as time, memory, etc. R, however, lacks a standard tool for performance testing R packages. Rperform had started as a GSoC 2015 project and was again accepted in GSoC 2016. From its README,
Rperform is an R package that makes it easy for R package developers to track quantitative performance metrics of their code, over time. It focuses on providing changes, related to time and memory, brought over in the package’s performance metrics over subsequent development versions and across git branches. Also, you can use Rperform with travis-ci to do performance testing during your travis build by adding some sample scripts to your git repository.
What other R packages with similar functionality already exist? Why aren't they good enough?
There are several focus areas which will be worked upon on this project. They include:
-
Allow for efficient and easier performance testing of standalone files; make performance testing of package more intuitive and easier.
-
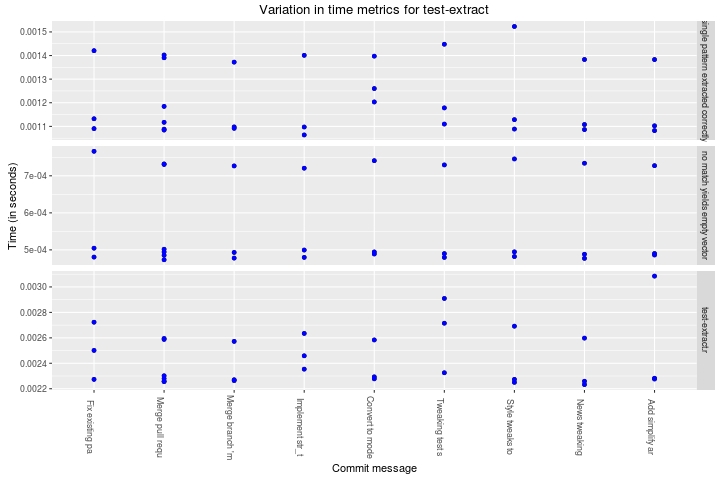
Improvement of the visualization functions: One of the most prominent and helpful feature of Rperform are the visualization functions it provides. Here's an example plot generated by Rperform after analyzing the runtime performance of a unit test from Hadley Wickham's stringr package.

Details about the same can be found on the Rperform Wiki. The visualization functions need to be improved upon and made interactive using packages such as animint. The direction this aspect of the project takes will heavily depend on how the UI implementation is done (see below).
-
Creating a coherent and useful user interface: Currently, Rperform does have a function which generates a webpage comprised of multiple plots obtained after analyzing the package code. However, there is a need for development of a proper user interface for the package developer to be able to interact meaningfully with the results. Inspiration for the same can be taken from projects such as asv and codespeed. TODO list specific features from these other tools that you would like to implement. Some potentially useful features are:
- Option to display plots for various files using a dropdown menu. Also, being able to display multiple plots at the same time for comparison purposes.
- Function to find a commit that produces a large regression (inspired from asv).
- Make the plots interactive. Hovering over a datapoint provides details about the commit such as date, author, etc.
-
Improve test suite and increase code coverage: Rperform currently lacks adequate number of unit tests. With increased functionality, working on this aspect will become even more important.
-
Make package CRAN-ready: The package, at the end of the project, should pass R CMD CHECK.
Mentors, please explain how this project will produce a useful package for the R community.
- Akash Tandon had worked on the package during GSoC 2015, 2016 and will be a mentor for the project, if selected, this year.
- Easy: Install Rperform package and recreate this example from Rperform's wiki page for a fresh fork of the stringr package. Only
Students, please post a link to your test results here.