The purpose of this document is to describe the general functionality of the API for data science purposes, with attention to integration with geospatial libraries in R and Python. Comments on general performance and suggested best practices for using the API resources are below.
Testing the default queries from R using httr::GET() returns GeoJSON that can be readily accessed by R’s spatial libraries. We’ll first make a request to the API and check its performance:
library(httr)

headers = c(
    'api' = 'Xy4Gq51ixT3OYvZPqhb3D5OdemA3BYZ06ISg5Duo',
    'Access' = '',
    'Authorization' = 'Bearer
eyJraWQiOiJJRzhDcXFYenEzR1dGWTk5bUdwK0VkZzVNbUNLa1RCSXpJT3dJdFdQc
mZzPSIsImFsZyI6IlJTMjU2In0.eyJzdWIiOiJjYmMyNWY4ZS01MmE3LTQwZDUtYm
JlMS0wYmYwYTI5N2MxMGIiLCJlbWFpbF92ZXJpZmllZCI6dHJ1ZSwiaXNzIjoiaHR
0cHM6XC9cL2NvZ25pdG8taWRwLnVzLWVhc3QtMS5hbWF6b25hd3MuY29tXC91cy1l
YXN0LTFfTkU5MXphYXBYIiwiY29nbml0bzp1c2VybmFtZSI6Im1mLWludC10ZXN0Q
HlvcG1haWwuY29tIiwib3JpZ2luX2p0aSI6IjcxMWI4NWZkLTdkZmUtNDQ4Zi1hMD
k0LTBlMjdjNzIzYjc0YSIsImF1ZCI6IjZ1bTk5ZnYycXRiNmY3aXNlM2kwMzd2bmE
iLCJldmVudF9pZCI6IjZjYWNkYzQ4LTE2YTEtNDcyNi04YTYyLWJmZmVlZGJjZjE2
NiIsInRva2VuX3VzZSI6ImlkIiwiYXV0aF90aW1lIjoxNjU3MzI1MzAyLCJleHAiO
jE2NTczMjg5MDIsImlhdCI6MTY1NzMyNTMwMiwianRpIjoiMjZlMzUzMGYtMTc3Mi
00NzUzLTk1ZDgtNDM5NjE5N2UxM2YzIiwiZW1haWwiOiJtZi1pbnQtdGVzdEB5b3B
tYWlsLmNvbSJ9.ZNnTbwnBTQfC57G9zQnVQO3gFZh9IPh9Z4hJ85vCmfCpody0bBj
yAGKWH8at26TscM6OZJzs52HFAGxhGUf6chCIqQUlXNB2q3UwuHd7qh9imA0EESfMt70V7nxRTS17BXXAwiMZhPgngk29mTQm9M4psL6n7z
Dr0heEwS7bOGH9Nzp55hdNWWEHKPGQr81mFloXJnhQiyMAHC3BkJx_
cBiTSAQcFcqqPJW1iH7lyC9thmsboxOlLG9IK6R5J
WR2uz05CJvp49L3XneAG-IWw3OSQuVi81UFIcv5RnAgi3MuLG6J8uS9sIa6QNSHxxLYicURRZC7ak0mVBvlaVA'
)

tictoc::tic()
request <- GET(url = "https://d25ssrwsq4u9bu.cloudfront.net/bcat/
county_broadband_farm_bill_eligibility/geojson?state_abbr=TN",
add_headers(headers))
tictoc::toc()

10.996 sec elapsed
In loading into R, the farm bill eligibility data tends to load in between 10 and 16 seconds. This is likely fine for data science purposes, though you may prefer to use the MVT endpoint for dynamic querying of tiles in an interactive app context. The county-specific datasets load in a second or less, even when a few counties are requested.
The request can be read into R as a simple features object and mapped for review:
library(sf)
library(mapview)
request_geo <- request %>%
content(as = "text") %>%
st_read(quiet = TRUE)
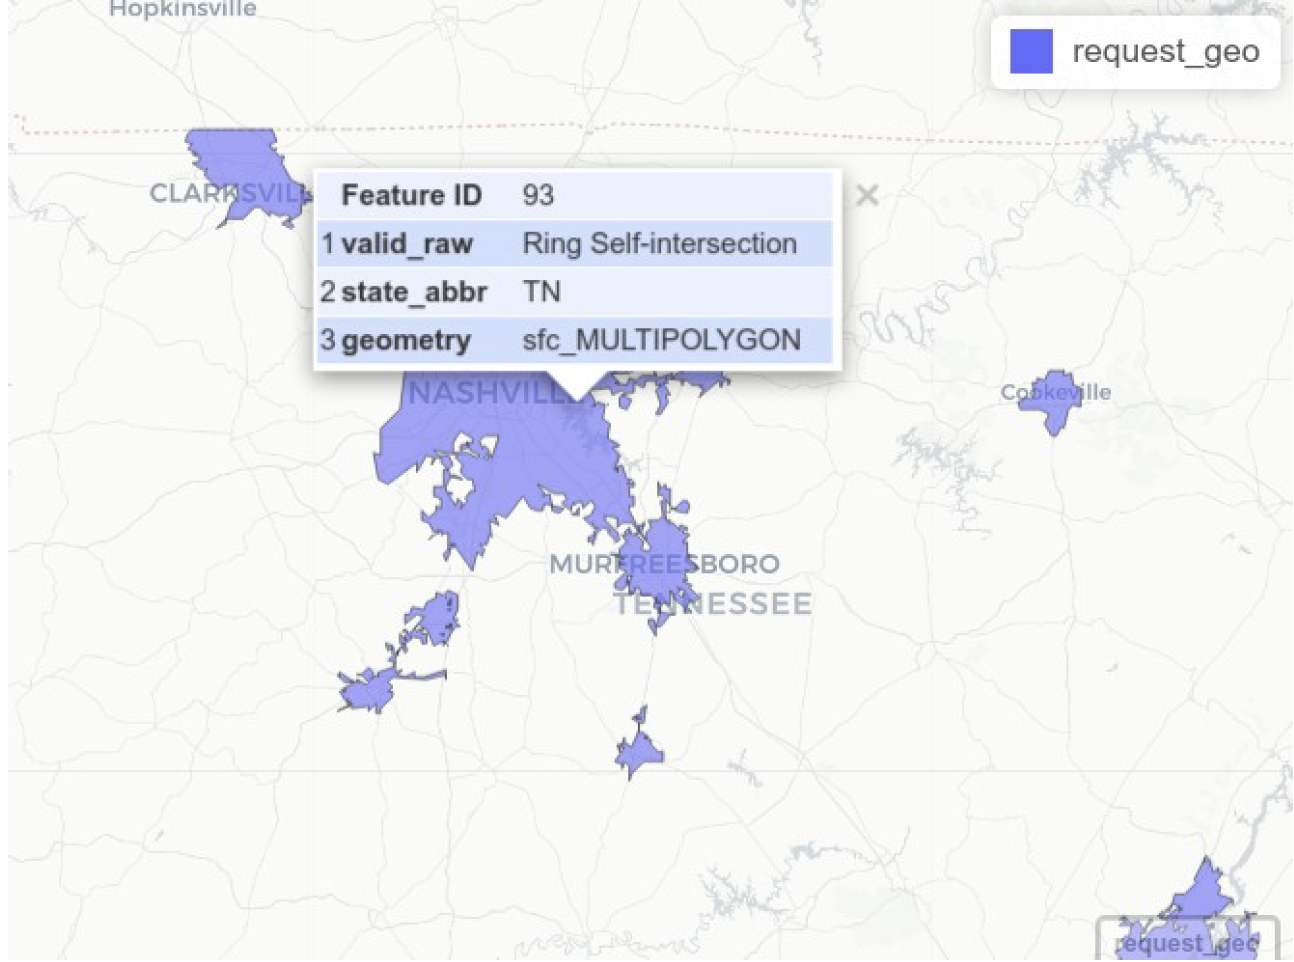
mapview(request_geo)The request can be converted to a simple features object and mapped quite quickly. The Feature ID “valid_raw” value will need context from the CORI team.
The API is configured for wrapping in a general access function. Storing in the authentication would be done through an environment variable, but would work something like this:
get_cori <- function(dataset, geoids) {
  # Some sort of function like `get_headers()` that grabs the stored tokens
  # headers <- get_headers()
  endpoint <-
glue::glue("https://d25ssrwsq4u9bu.cloudfront.net/bcat/{dataset}/
geojson")

  req <- httr::GET(url = endpoint,
                         query = list(geoid_co = paste0(geoids, collapse = ",")),
                         httr::add_headers(headers))

if (req$status_code == 200) {
  # If successful, return the spatial object
  req_sf <- req %>%
    httr::content(as = "text") %>%
    sf::st_read(quiet = TRUE)

  return(req_sf)
} else {
  # Otherwise, return the error message
  msg <- httr::content(req, as = "text")
  rlang::abort(message = glue::glue("Your request failed. The error message is {msg}"))
}
}
Now, this will only work for endpoints that have the geoid_co parameter so broader adjustments would need to be made. Let’s try it out:
awards <- get_cori(
  dataset = "auction_904_subsidy_awards",
  geoids = c("48113", "48439")
)
mapview(awards)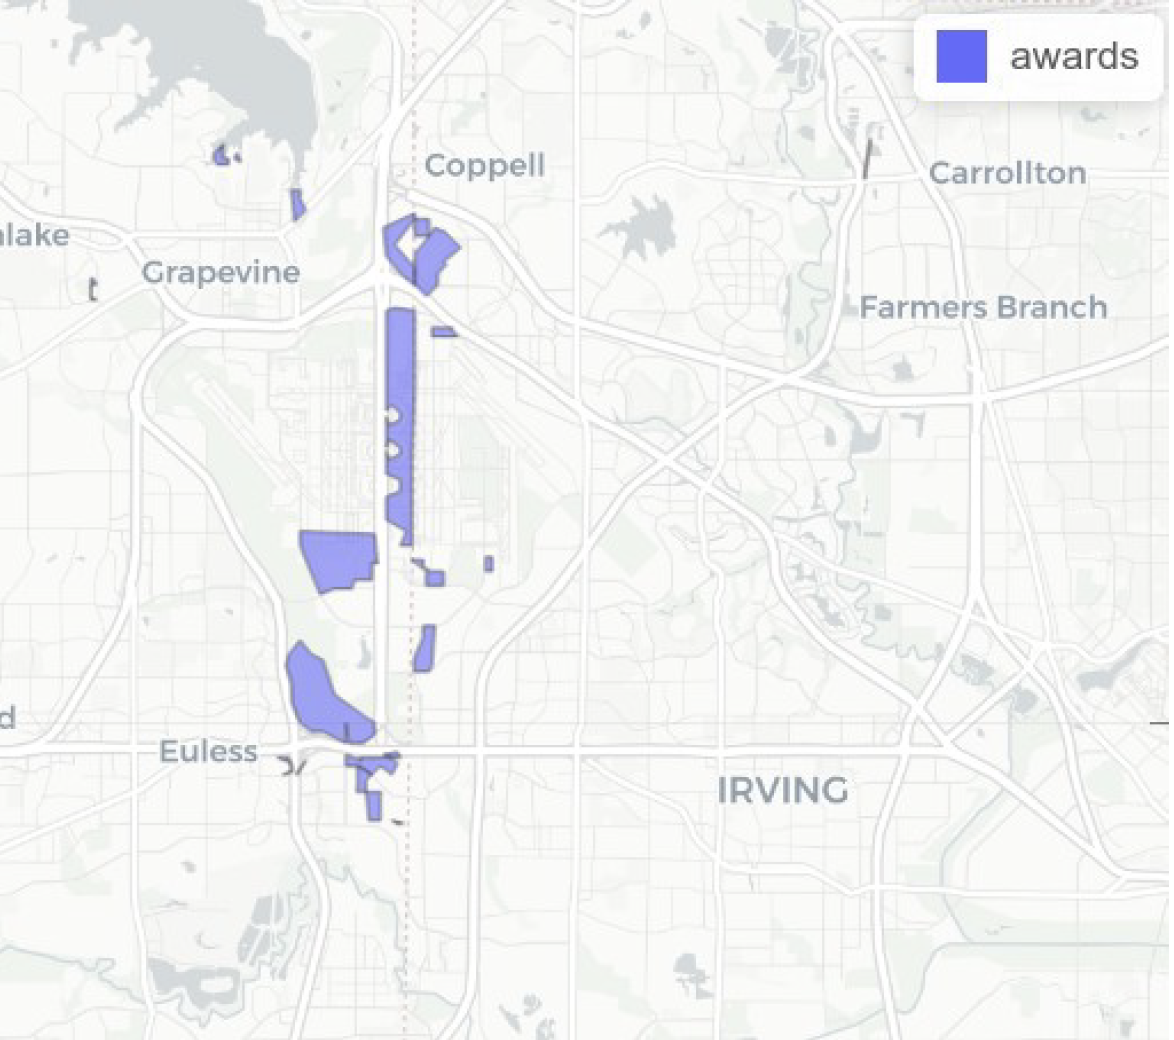
Python access to the API will work much the same way, and quick mapping of the data is possible if the appropriate tools are installed. The workflow outlined below fetches the data using requests, then reads in the result with geopandas and maps the data with leafmap.
import requests

url =
"https://d25ssrwsq4u9bu.cloudfront.net/bcat/auction_904_subsidy_awards/geojson?geoid_co=47001,47003,47011"

payload={}
headers = {
  'api': 'Xy4Gq51ixT3OYvZPqhb3D5OdemA3BYZ06ISg5Duo',
  'Access': '',
  'Authorization': 'Bearer
eyJraWQiOiJJRzhDcXFYenEzR1dGWTk5bUdwK0VkZzVNbUNLa1RCSXpJT3dJdFdQc
mZzPSIsImFsZyI6IlJTMjU2In0.eyJzdWIiOiJjYmMyNWY4ZS01MmE3LTQwZDUtYm
JlMS0wYmYwYTI5N2MxMGIiLCJlbWFpbF92ZXJpZmllZCI6dHJ1ZSwiaXNzIjoiaHR
0cHM6XC9cL2NvZ25pdG8taWRwLnVzLWVhc3QtMS5hbWF6b25hd3MuY29tXC91cy1l
YXN0LTFfTkU5MXphYXBYIiwiY29nbml0bzp1c2VybmFtZSI6Im1mLWludC10ZXN0Q
HlvcG1haWwuY29tIiwib3JpZ2luX2p0aSI6IjcxMWI4NWZkLTdkZmUtNDQ4Zi1hMD
k0LTBlMjdjNzIzYjc0YSIsImF1ZCI6IjZ1bTk5ZnYycXRiNmY3aXNlM2kwMzd2bmE
iLCJldmVudF9pZCI6IjZjYWNkYzQ4LTE2YTEtNDcyNi04YTYyLWJmZmVlZGJjZjE2
NiIsInRva2VuX3VzZSI6ImlkIiwiYXV0aF90aW1lIjoxNjU3MzI1MzAyLCJleHAiO
jE2NTczMjg5MDIsImlhdCI6MTY1NzMyNTMwMiwianRpIjoiMjZlMzUzMGYtMTc3Mi
00NzUzLTk1ZDgtNDM5NjE5N2UxM2YzIiwiZW1haWwiOiJtZi1pbnQtdGVzdEB5b3B
tYWlsLmNvbSJ9.ZNnTbwnBTQfC57G9zQnVQO3gFZh9IPh9Z4hJ85vCmfCpody0bBj
yAGKWH8at26TscM6OZJzs52HFAGxhGUf6chCIqQUlXNB2q3UwuHd7qh9imA0EESfMt70V7nxRTS17BXXAwiMZhPgngk29mTQm9M4psL6n7z
Dr0heEwS7bOGH9Nzp55hdNWWEHKPGQr81mFloXJnhQiyMAHC3BkJx_
cBiTSAQcFcqqPJW1iH7lyC9thmsboxOlLG9IK6R5J
WR2uz05CJvp49L3XneAG-IWw3OSQuVi81UFIcv5RnAgi3MuLG6J8uS9sIa6QNSHxxLYicURRZC7ak0mVBvlaVA'
}

response = requests.request("GET", url, headers=headers, data=payload)

response.status_code

200
With the data in hand, we can read into Python as a GeoDataFrame.
import geopandas as gp

geo = gp.read_file(response.text)

geo.plot()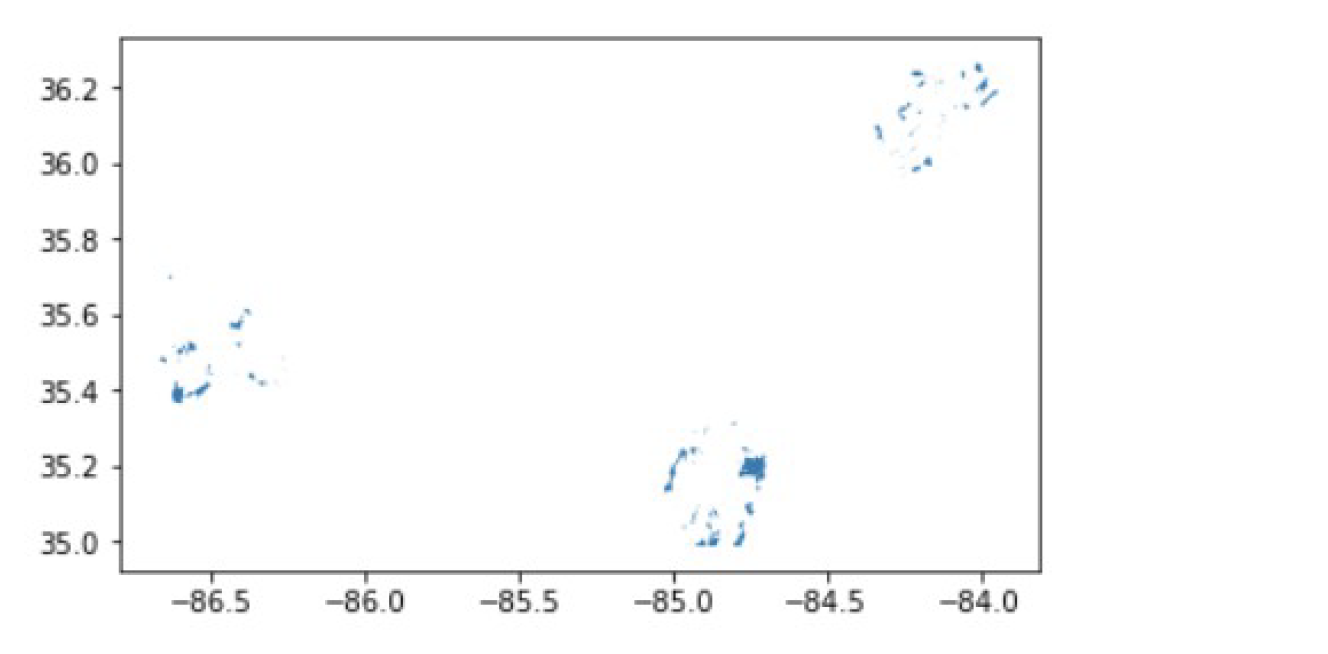
And interactively with leafmap:
import leafmap.leafmap as leafmap

m = leafmap.Map(center = [86.9066448, 35.8682], zoom = 7)

m.add_gdf(geo, "BCAT")

m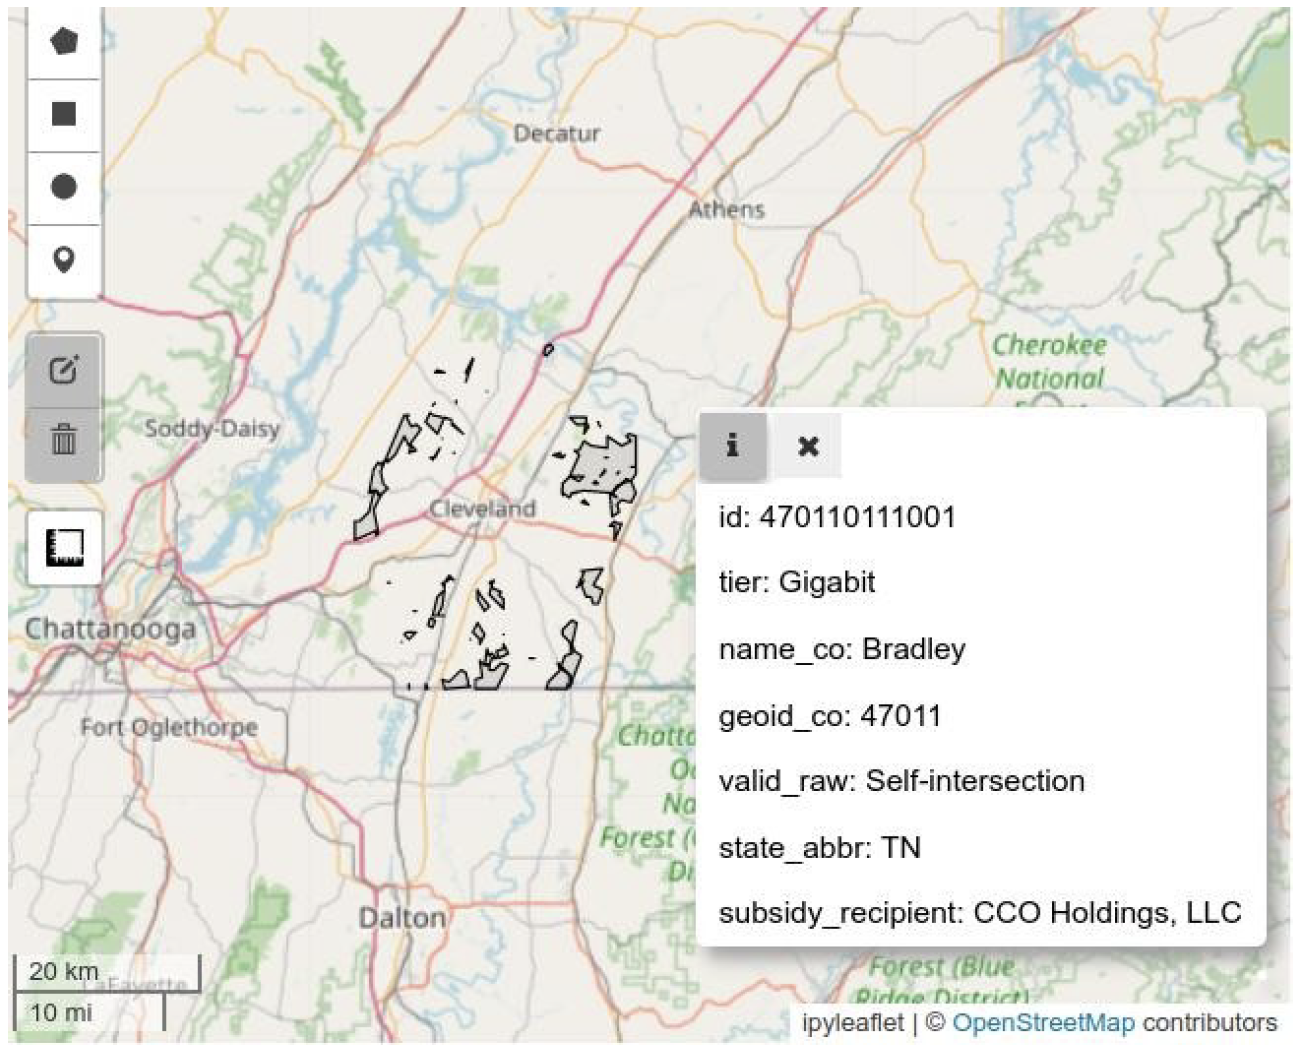
Putting this all together, a start at a function would look like this:
def get_cori(dataset, geoids):
  # headers = get_headers()
  payload={}

  sep = ","

  geoid_sep = sep.join(geoids)

  url = "https://d25ssrwsq4u9bu.cloudfront.net/bcat/" + dataset + "/geojson"

  qry = sep.join(geoids)

  req = requests.get(url, headers=headers, data=payload, params={'geoid_co':geoid_sep})

  if (req.status_code == 200):
    json = req.text
    geo = gp.read_file(json)
    return geo
  else:
    msg = req.text
    raise SystemExit(msg
The result works as below:
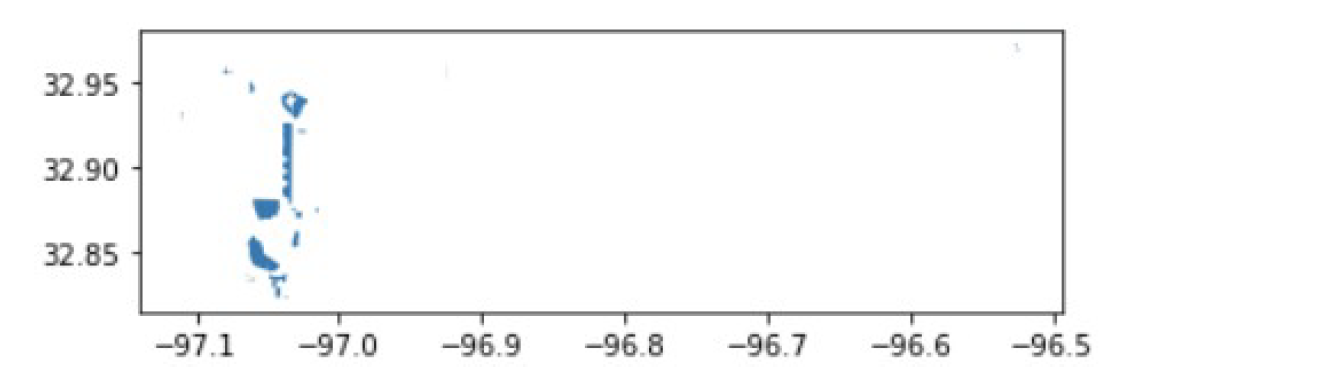
awards = get_cori("auction_904_subsidy_awards", geoids = ["48113", "48439"])
awards.plot()