Debug Your Plugin
For this section we will be using Visual Studio Code's built-in debugger.
The plug-in generated by plugin-dev includes debugging configuration settings for VS Code.
VS Code has two core debugging modes, launch and attach, see: https://code.visualstudio.com/Docs/editor/debugging#_launch-versus-attach-configurations for more info.
We will be using both modes while debugging a plug-in.
Debugging a command involves passing different arguments and/or flags during a debug session, for these cases the recommended way is to use the attach debug mode in VS Code for a better experience.
For the attach mode you will need to make the Node.js process listen for a debugging client, since oclif plugins use bin/dev as the main executable we will set the NODE_OPTIONS environment variable to pass options to it:
bash/zsh:
export NODE_OPTIONS='--inspect-brk'PowerShell
$Env:NODE_OPTIONS = '--inspect-brk'Now let's try to debug the hello world command from the generated plug-in and see how the hello message is created:
- In a terminal, change to the top-level directory of your plug-in and run this command to open it in VS Code:
code .- Open
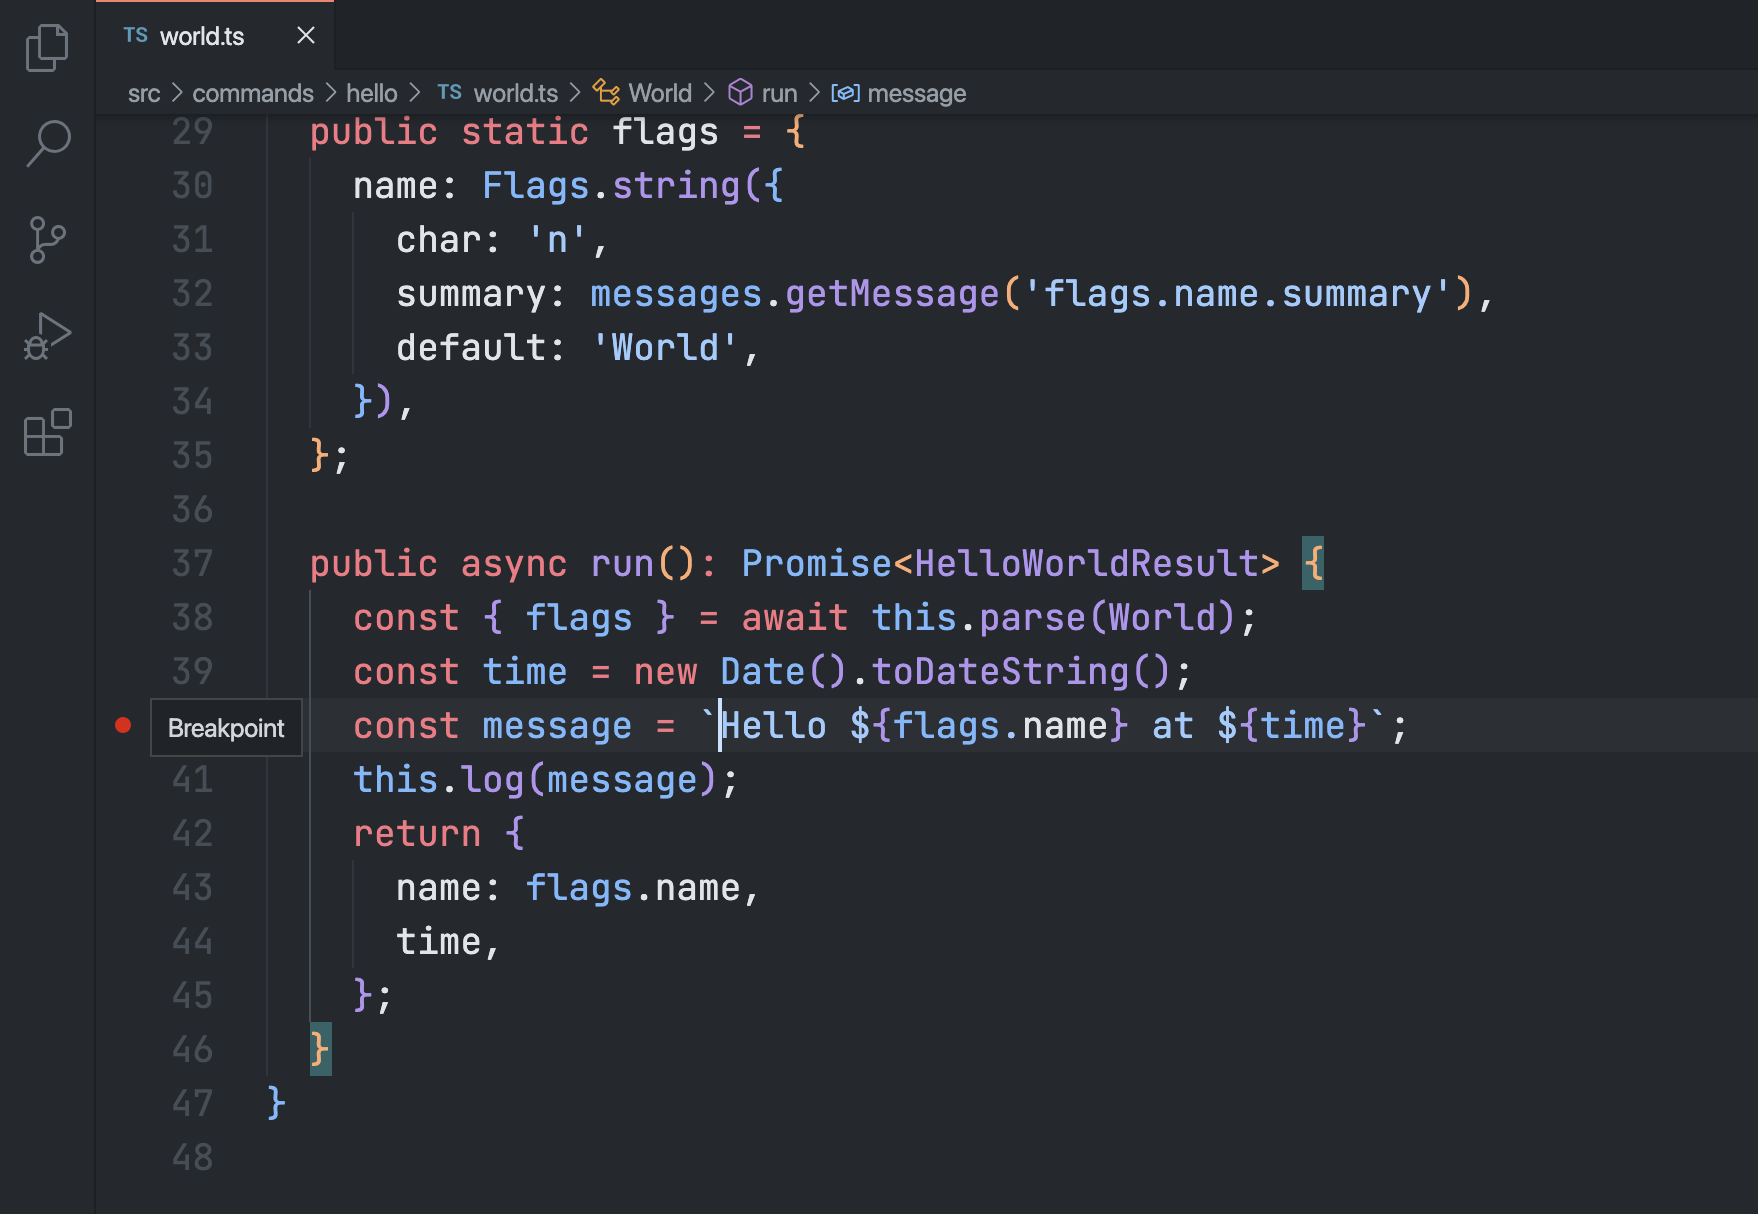
src/commands/hello/world.tsand set a breakpoint on line 40 by clicking on the editor margin or using F9 on the line:
- Run the
hello worldcommand usingbin/dev, the process now waits for a debugger to continue the execution:
./bin/dev hello world
Debugger listening on ws://127.0.0.1:9229/22bc83d3-0b97-4dbb-b228-1697d0a0878a
For help, see: https://nodejs.org/en/docs/inspector
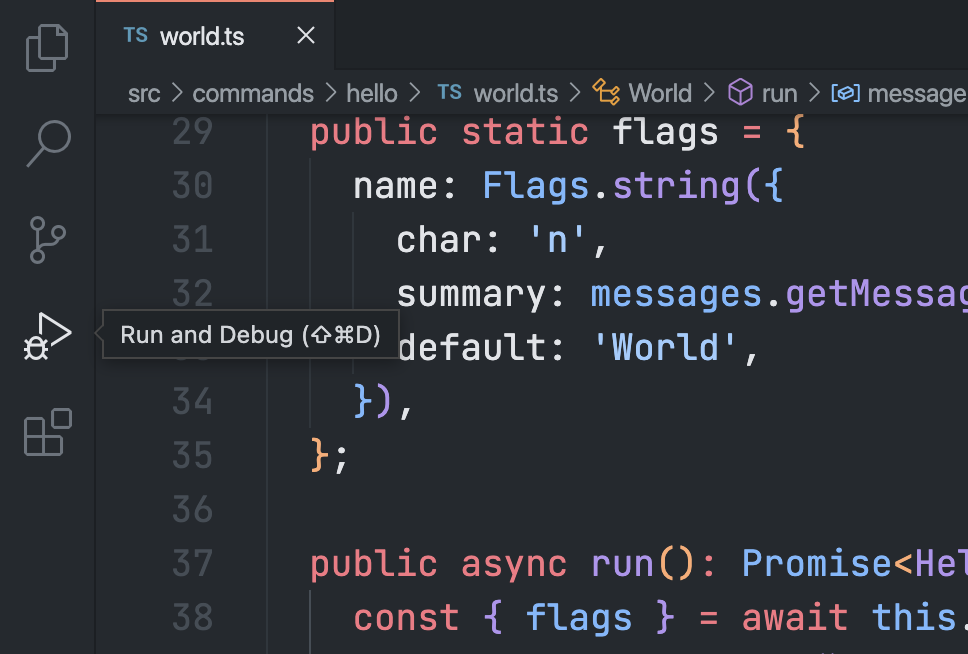
- Now attach the VS Code debugger to the CLI process from the previous step, to do that select the
Run and Debugicon in the Activity Bar on the side of VS Code:
then select the configuration named Attach using the Configuration dropdown in the Run and Debug view and press F5 to start a debug session.
Once the debugger is attached it will jump to line 3 of bin/dev as that's where the process start, you can continue the execution by pressing Continue in the Debug toolbar or F5
- After continuing with the execution you should see the debugger stop at the breakpoint set in step 2, if you look at the
VARIABLESsection you can see value of the local variables likeflagsandtime:
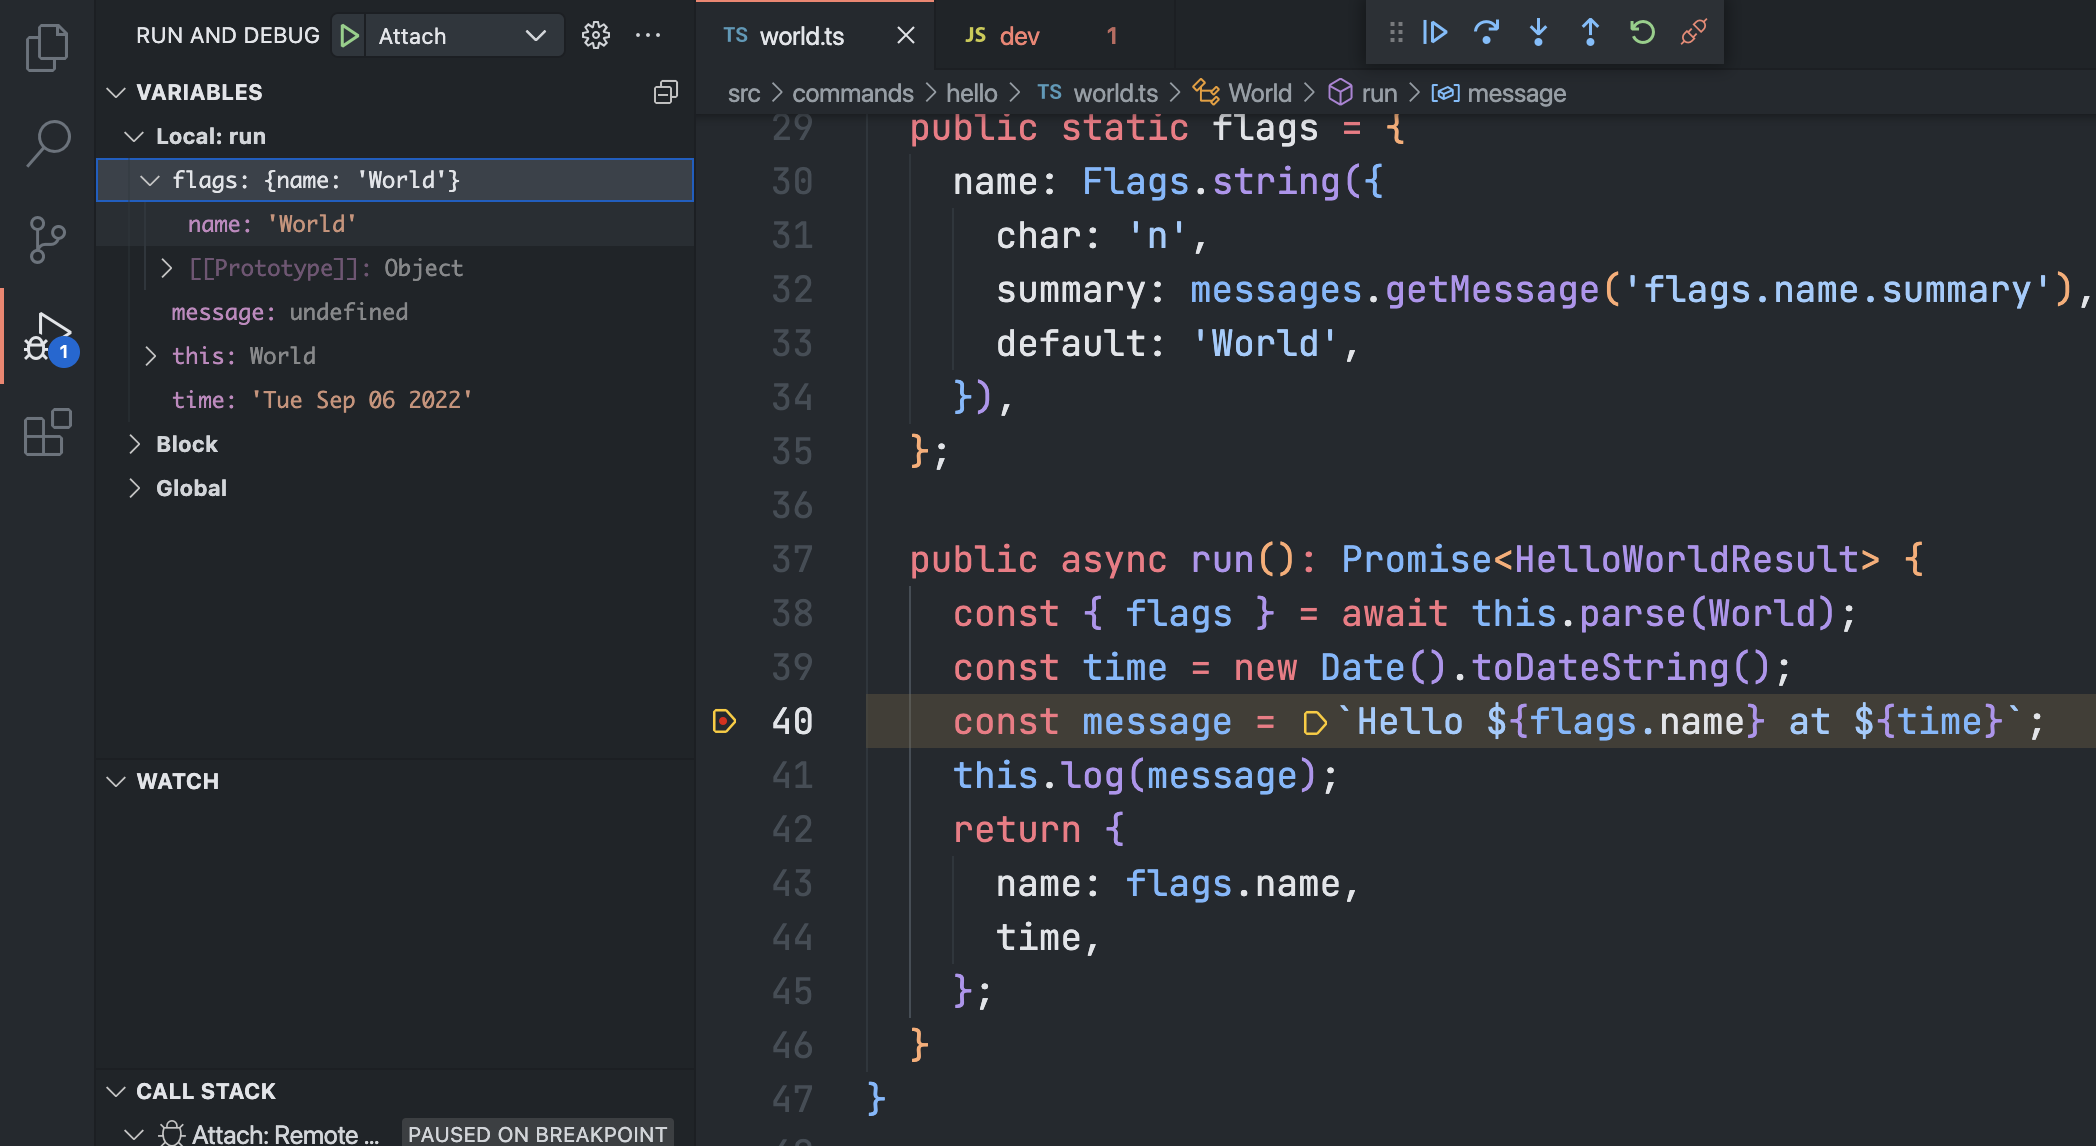
At this point the message variable is still undefined, that's because the debugger stopped right at line 40 which is where the variable is defined and initialized.
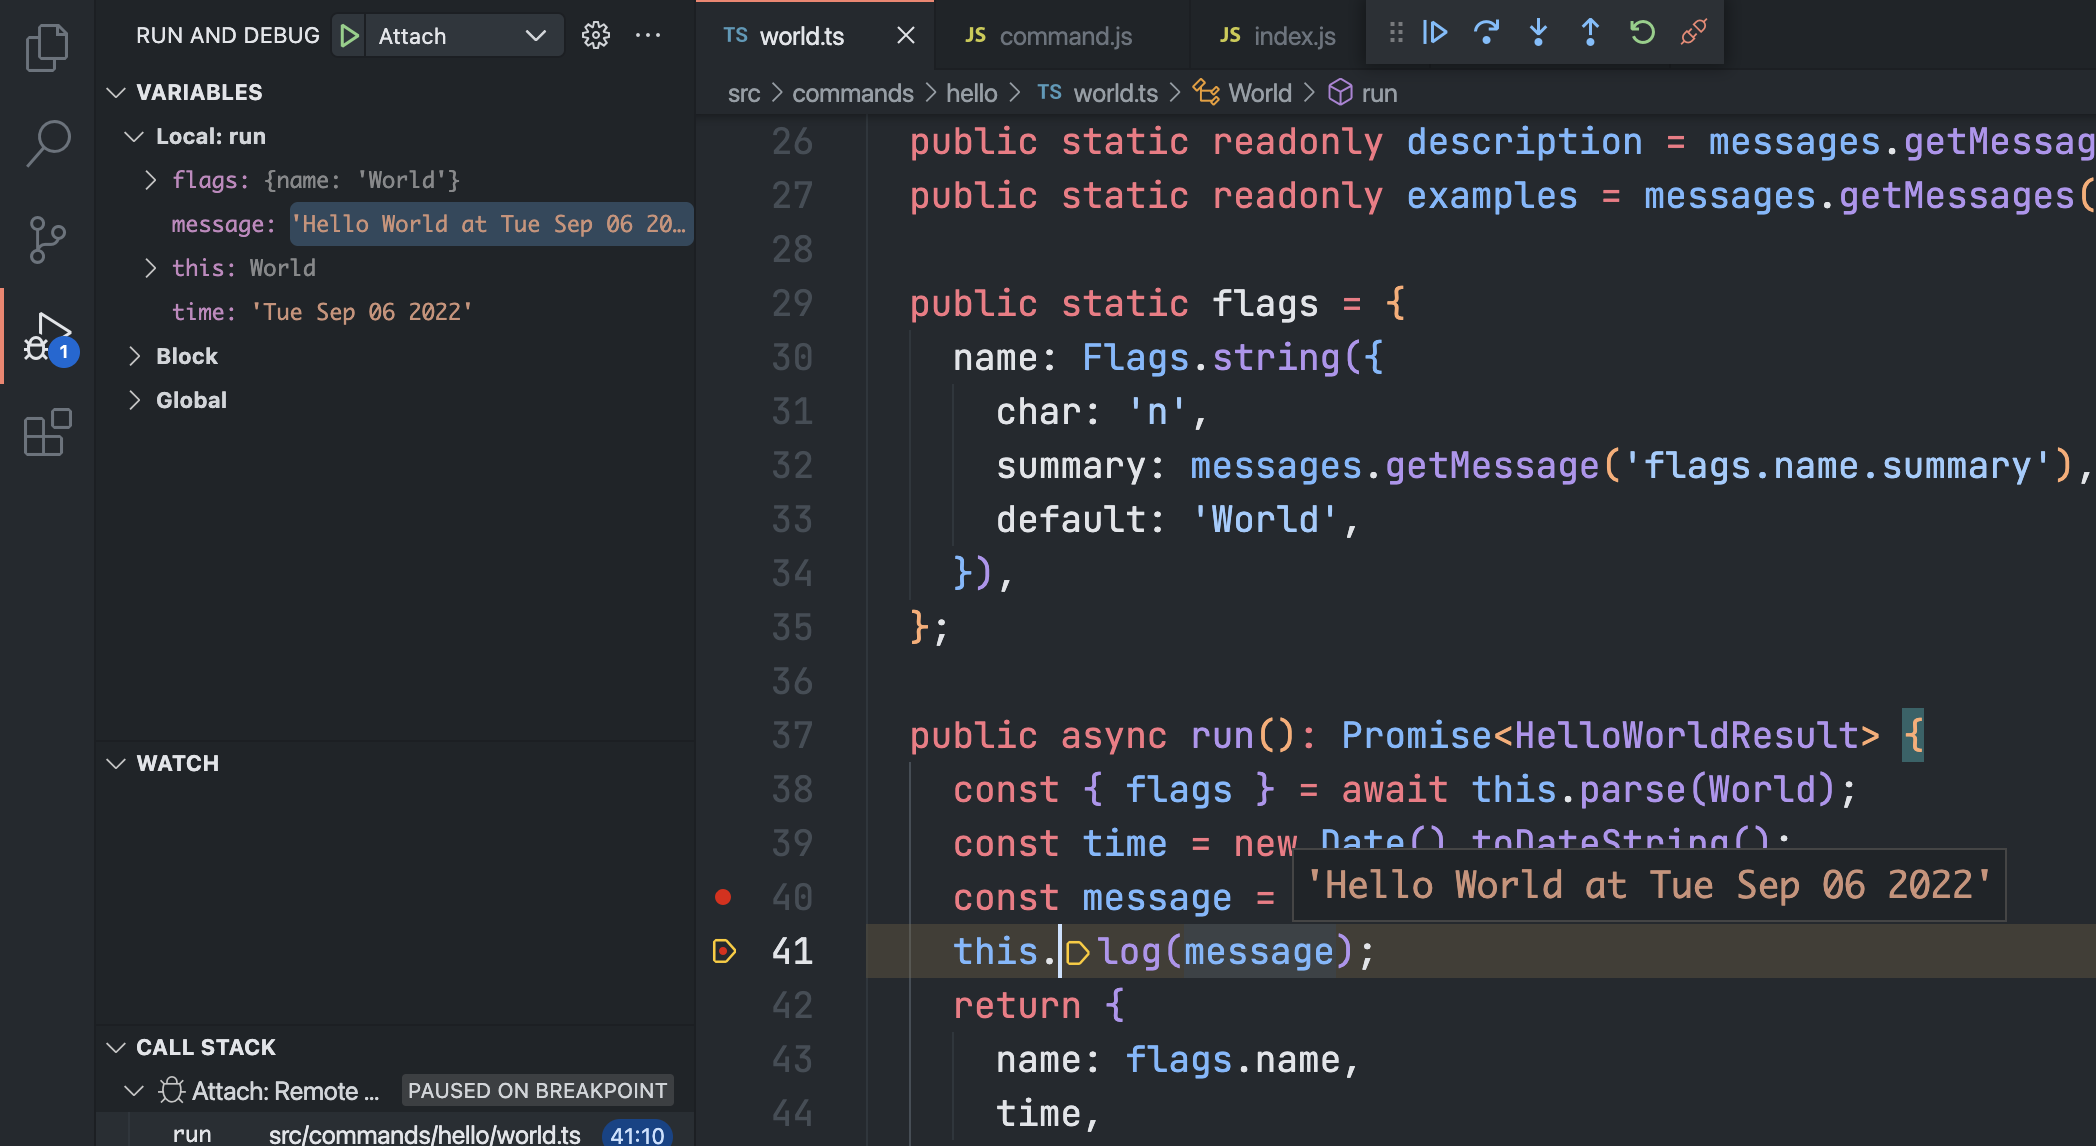
You can also set breakpoints after the debug session started. Try setting one at line 41 and press F5, the debugger will now stop at the next breakpoint.
If you hover over message on line 41 while the debugger is waiting you can see it holds the message to print:
If you want to dig into a function or method call, you can click on the Step Into option in the Debug Toolbar while on the line and the debugger jump to its definition.
To continue debugging over the next lines press Step Over in the Debug Toolbar or F10, after you are done press Continue or F5 to continue with the execution or Disconnect to deattach VS Code from the process.
- After you finished a debug session make sure to unset the
NODE_OPTIONSenvironment variable:
bash/zsh:
unset NODE_OPTIONSPowerShell
$Env:NODE_OPTIONS = ''Unlike debugging a command, you don't need to pass any options to a test as those are already in code.
For this case we will use the launch debug mode in VS Code to debug the hello world command unit test.
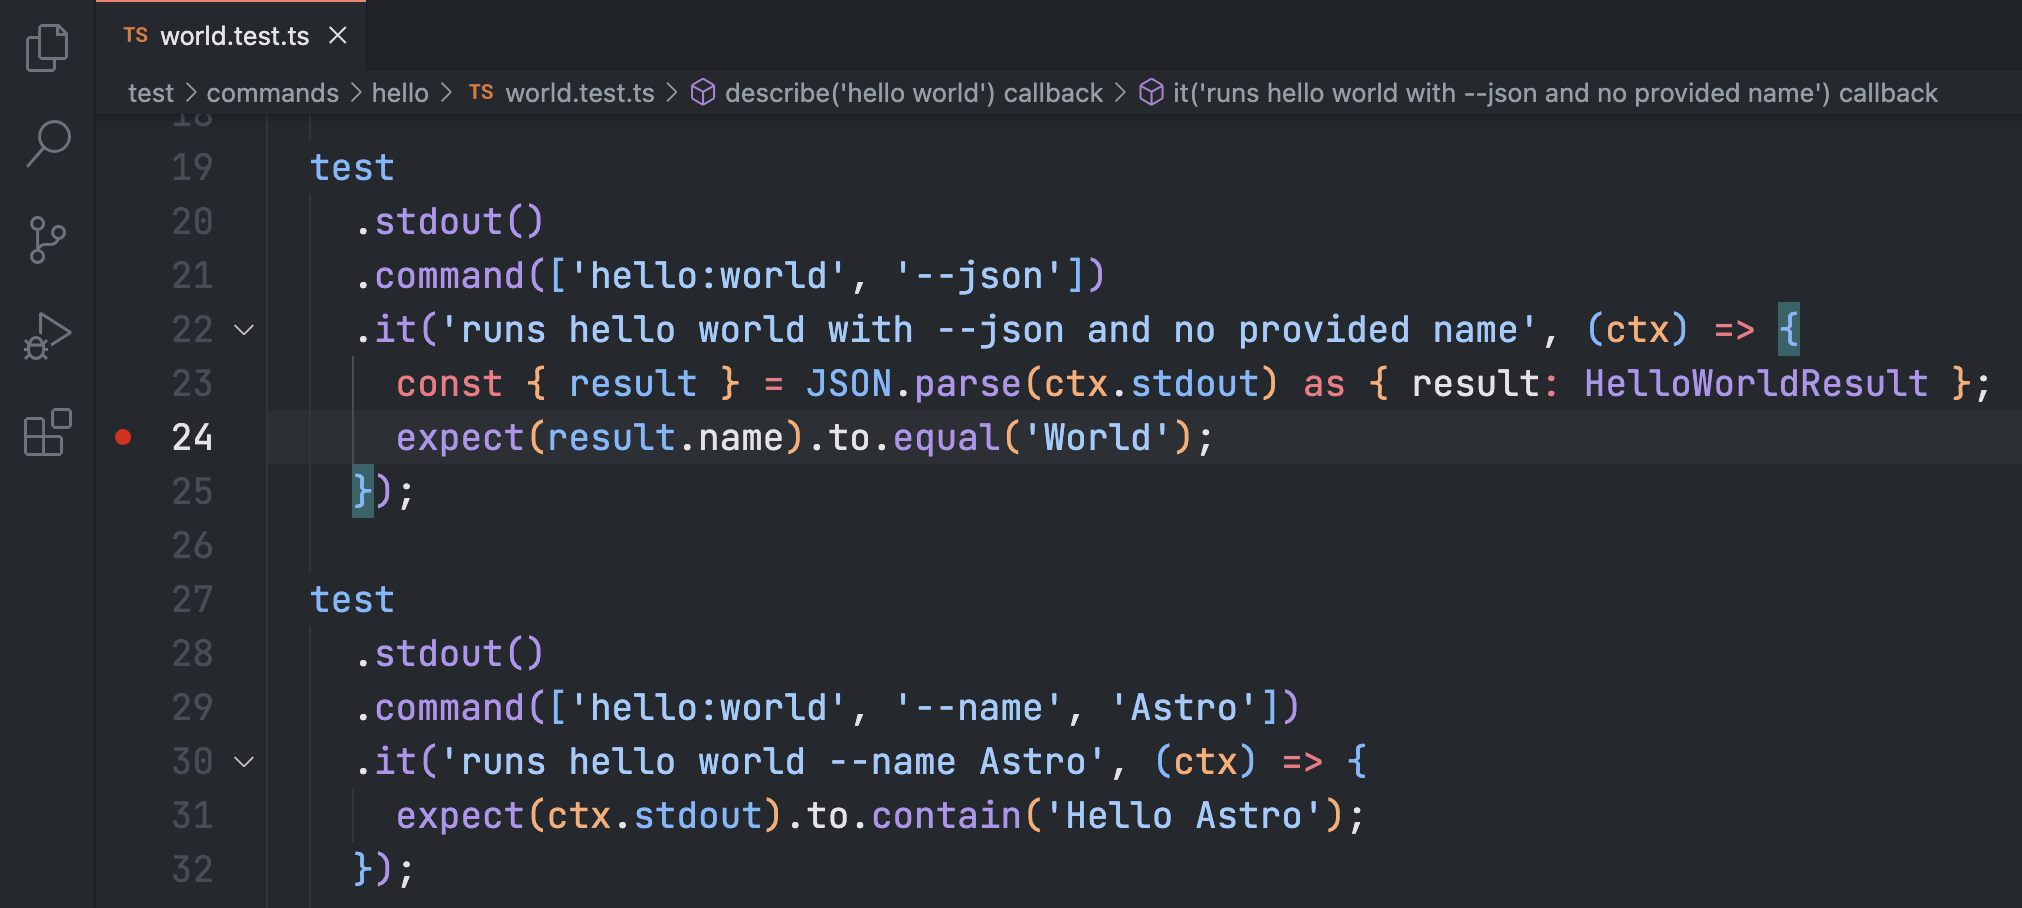
- Open
test/commands/hello/world.test.tsand set a breakpoint on line 24:
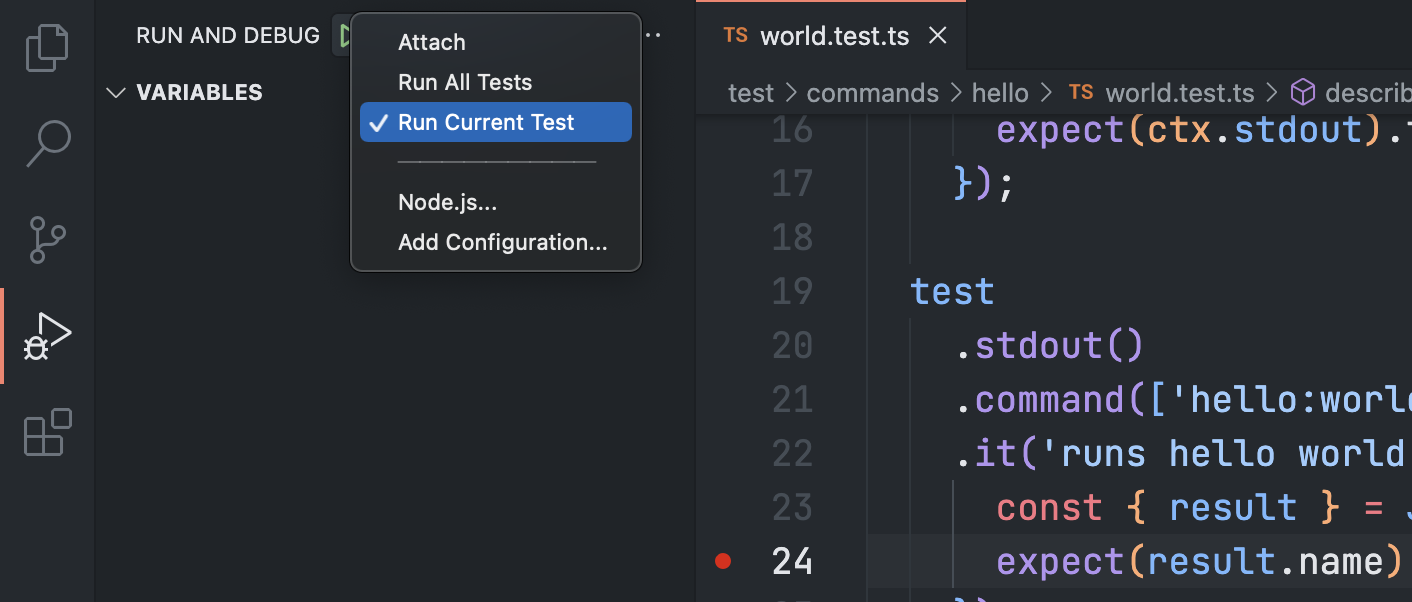
- Select the configuration named
Run Current Testusing the Configuration dropdown in theRun and Debugview and press F5 to start a debug session.
- In this mode VS Code starts the Node.js process to run the current open test file, then the execution stopped right at the first breakpoint.
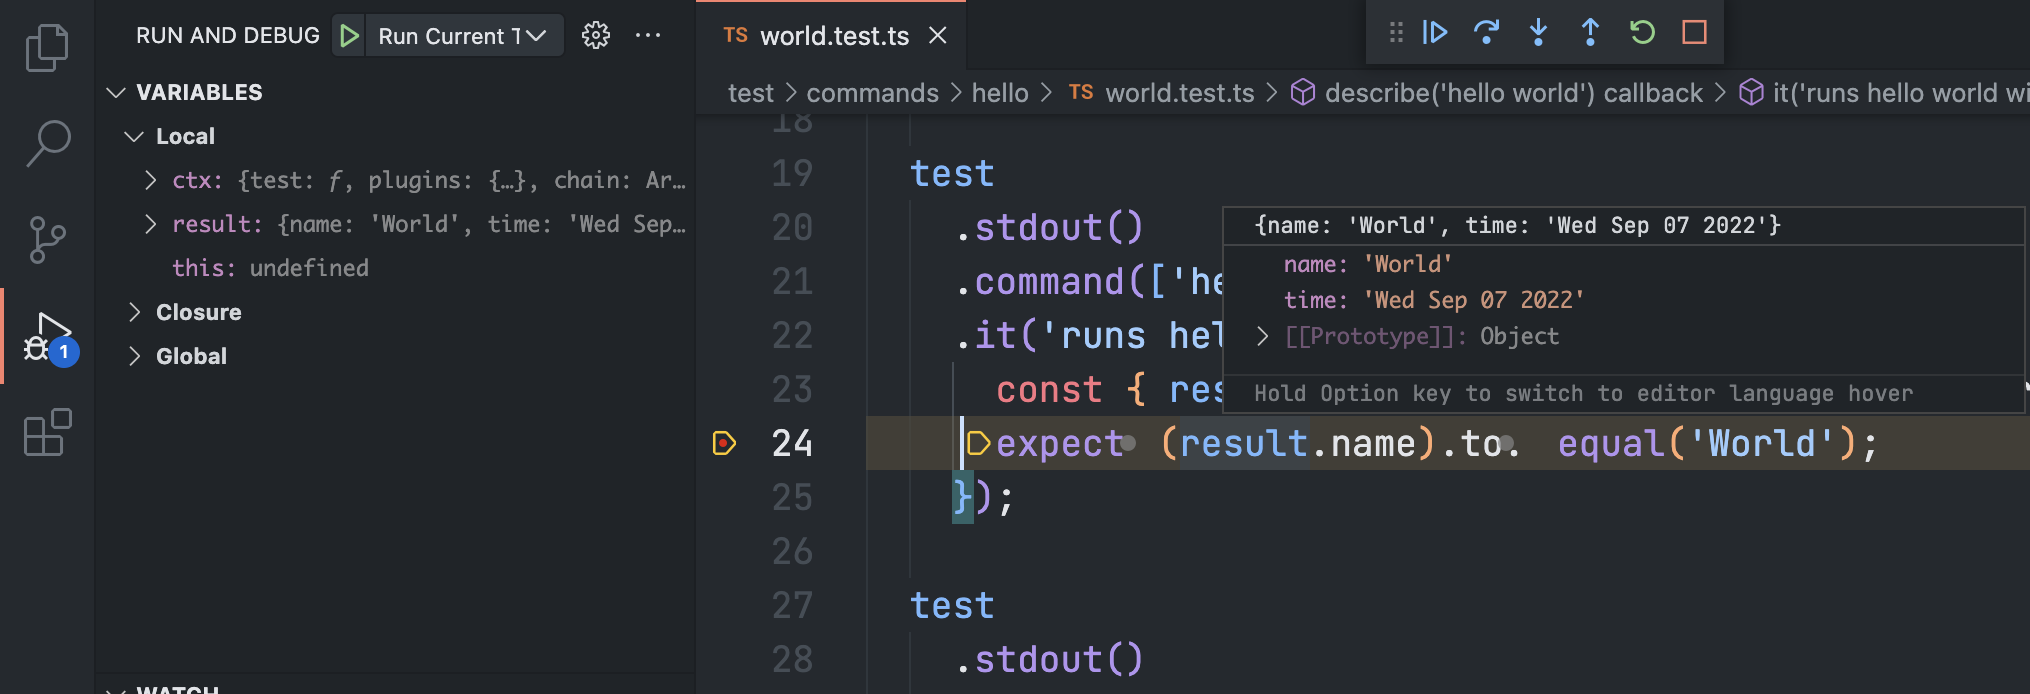
Try hovering over the
resultobject on line 24 to see the JSON output the command in the test case returned:
To continue debugging over the next lines press Step Over in the Debug Toolbar or F10, after you are done press Continue or F5 to continue with the execution or Stop to finish the Node.js process.