Embedding
An embedding of a graph is an assignment of points in the plane to the vertices of the graph. To visualize a graph in its current embedding, see the DrawSimpleGraphs module or one of the Exporting functions.
A graph's embedding is part of the graph's data structure. See the Cache page of this Wiki.
Note: A graph's embedding is independent of its rotation system. See this entry for more detail.
-
embed(G)givesGthe circular embedding. -
embed(G,method)givesGan embedding using one of the following methods:-
:circular: vertices arranged in a circle. -
:random: vertices placed at random locations. -
:spring: model edges as springs and vertices are repelling bodies. -
:spectral: coordinates based on eigenvectors for the 2nd and 3rd smallest eigenvalues. -
:stress: attempt to place vertices so their geometric distance matches their graph-theoretic distance. -
:combined: First do a:springand then do a:stressembedding. Often gives attractive results. -
:tutte: Given a list of vertices of be placed at the corners of a regular convex polygon, embed the other vertices at the center of mass of their neighbors. If no list is given, then use the graph's rotation system and select a largest face for the outside vertices.
-
-
embed(G,d):dis a dictionary mapping vertices to[x,y]vectors (one-dimensional arrays).
-
transform(G,A,b): modify the embedding by applying an affine function to the coordinates. -
recenter(G): moves the center of the embedding to the origin.
The following functions affect how the graph is drawn in DrawSimpleGraphs:
-
set_vertex_size(G,r): specify the radius of the circle we draw to represent a vertex (default is 6). -
get_vertex_size(G): returns the vertex drawing radius. -
set_line_color(G,color): specify the color for the vertex circles and edge line segments (default is "black"). -
get_line_color(G): returns the line color. -
set_vertex_color(G,color): specify the color that fills in the vertex circles (default is "white"). -
get_vertex_color(G): return the fill color.
-
has_embedding(G): check if the graph has been given an embedding. -
remove_embedding(G): removed the graph's embedding from its internal data structure. -
getxy(G): return the dictionary mapping the vertices to[x,y]vectors. -
edge_length(G,e): return the distance between the end points of edgee.
These are marginally supported functions for output of the graph's embedding for use by other applications.
-
graffle(G,file_name,radius): output a file to be opened by OmniGraffle. -
geogebra(G,file_name): output a Geogebra script file to draw this graph. -
tikz_file(G,file_name): output Tikz code that can be imported into LaTeX.
The following images were formed by applying an embedding to a graph G = Dodecahedron()
followed by draw(G) (which requires the DrawSimpleGraphs module):
Calling G = Dodecahedron() automatically gives G the tutte embedding using a specific 3-cycle as the outer face:
embed(G, :tutte, outside = [1, 9, 2]). Here is the result:

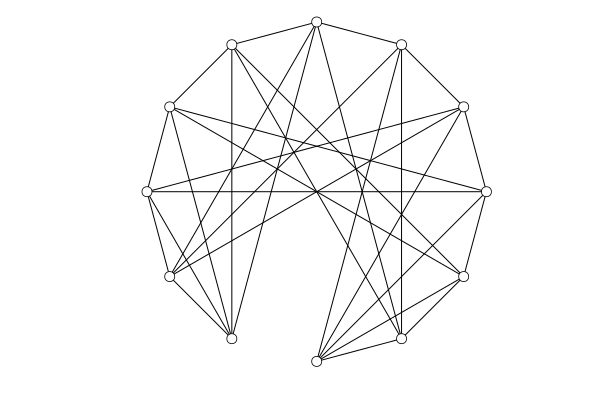
This is the result of embed(G,:spring):
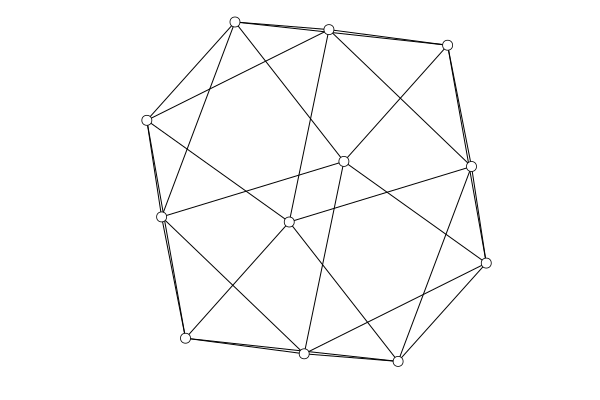
This is the result of embed(G,:stress) (which is similar to embed(G,:combined) because
if followed a spring embedding):

This is the result of the base embed(G) which places all vertices around a circle: