Memory leaks discussion #2286
Replies: 1 comment 14 replies
-
|
could you try latest alpha release to reproduce this? |
Beta Was this translation helpful? Give feedback.
-
|
To surpass a possible question - no additional dependencies aren't provided for |
Beta Was this translation helpful? Give feedback.
-
|
So, it can be reduced to just simple |
Beta Was this translation helpful? Give feedback.
-
|
Interesting stuff. I've found gesture handler and reanimated to be the cause of severe memory problem in our production app. I'm surprised there hasn't been a lot more discussion about the memory issues with these libraries, but maybe the majority of consumers are not using the apps that use these libraries for extended periods so the memory increase is not as noticeable. Our app is in constant use for long periods (3 hours +) and we've been having to tell our users to force close it to free up the memory. We are in the middle of a rewrite to remove all dependencies on gesture handler and reanimated, although #3722 will hopefully get rid of these issues. |
Beta Was this translation helpful? Give feedback.
-
|
there is a PR in progress where the team is rewriting shared values to address all the memory leaks and performance problems with them. |
Beta Was this translation helpful? Give feedback.
-
|
Yep, its the PR I linked to in my post 👍 |
Beta Was this translation helpful? Give feedback.
Uh oh!
There was an error while loading. Please reload this page.
-
Hi guys. I've experienced huge memory leaks with [email protected] , I've been digging into a problem for almost a week, and still can't find a root cause.
So, I've tried to locate the problem with a simple component, but it seems that the problem persist in more complicated ones. (I even draw a huge memory graph to identify loops, but for simple case it all looks safe and sound).
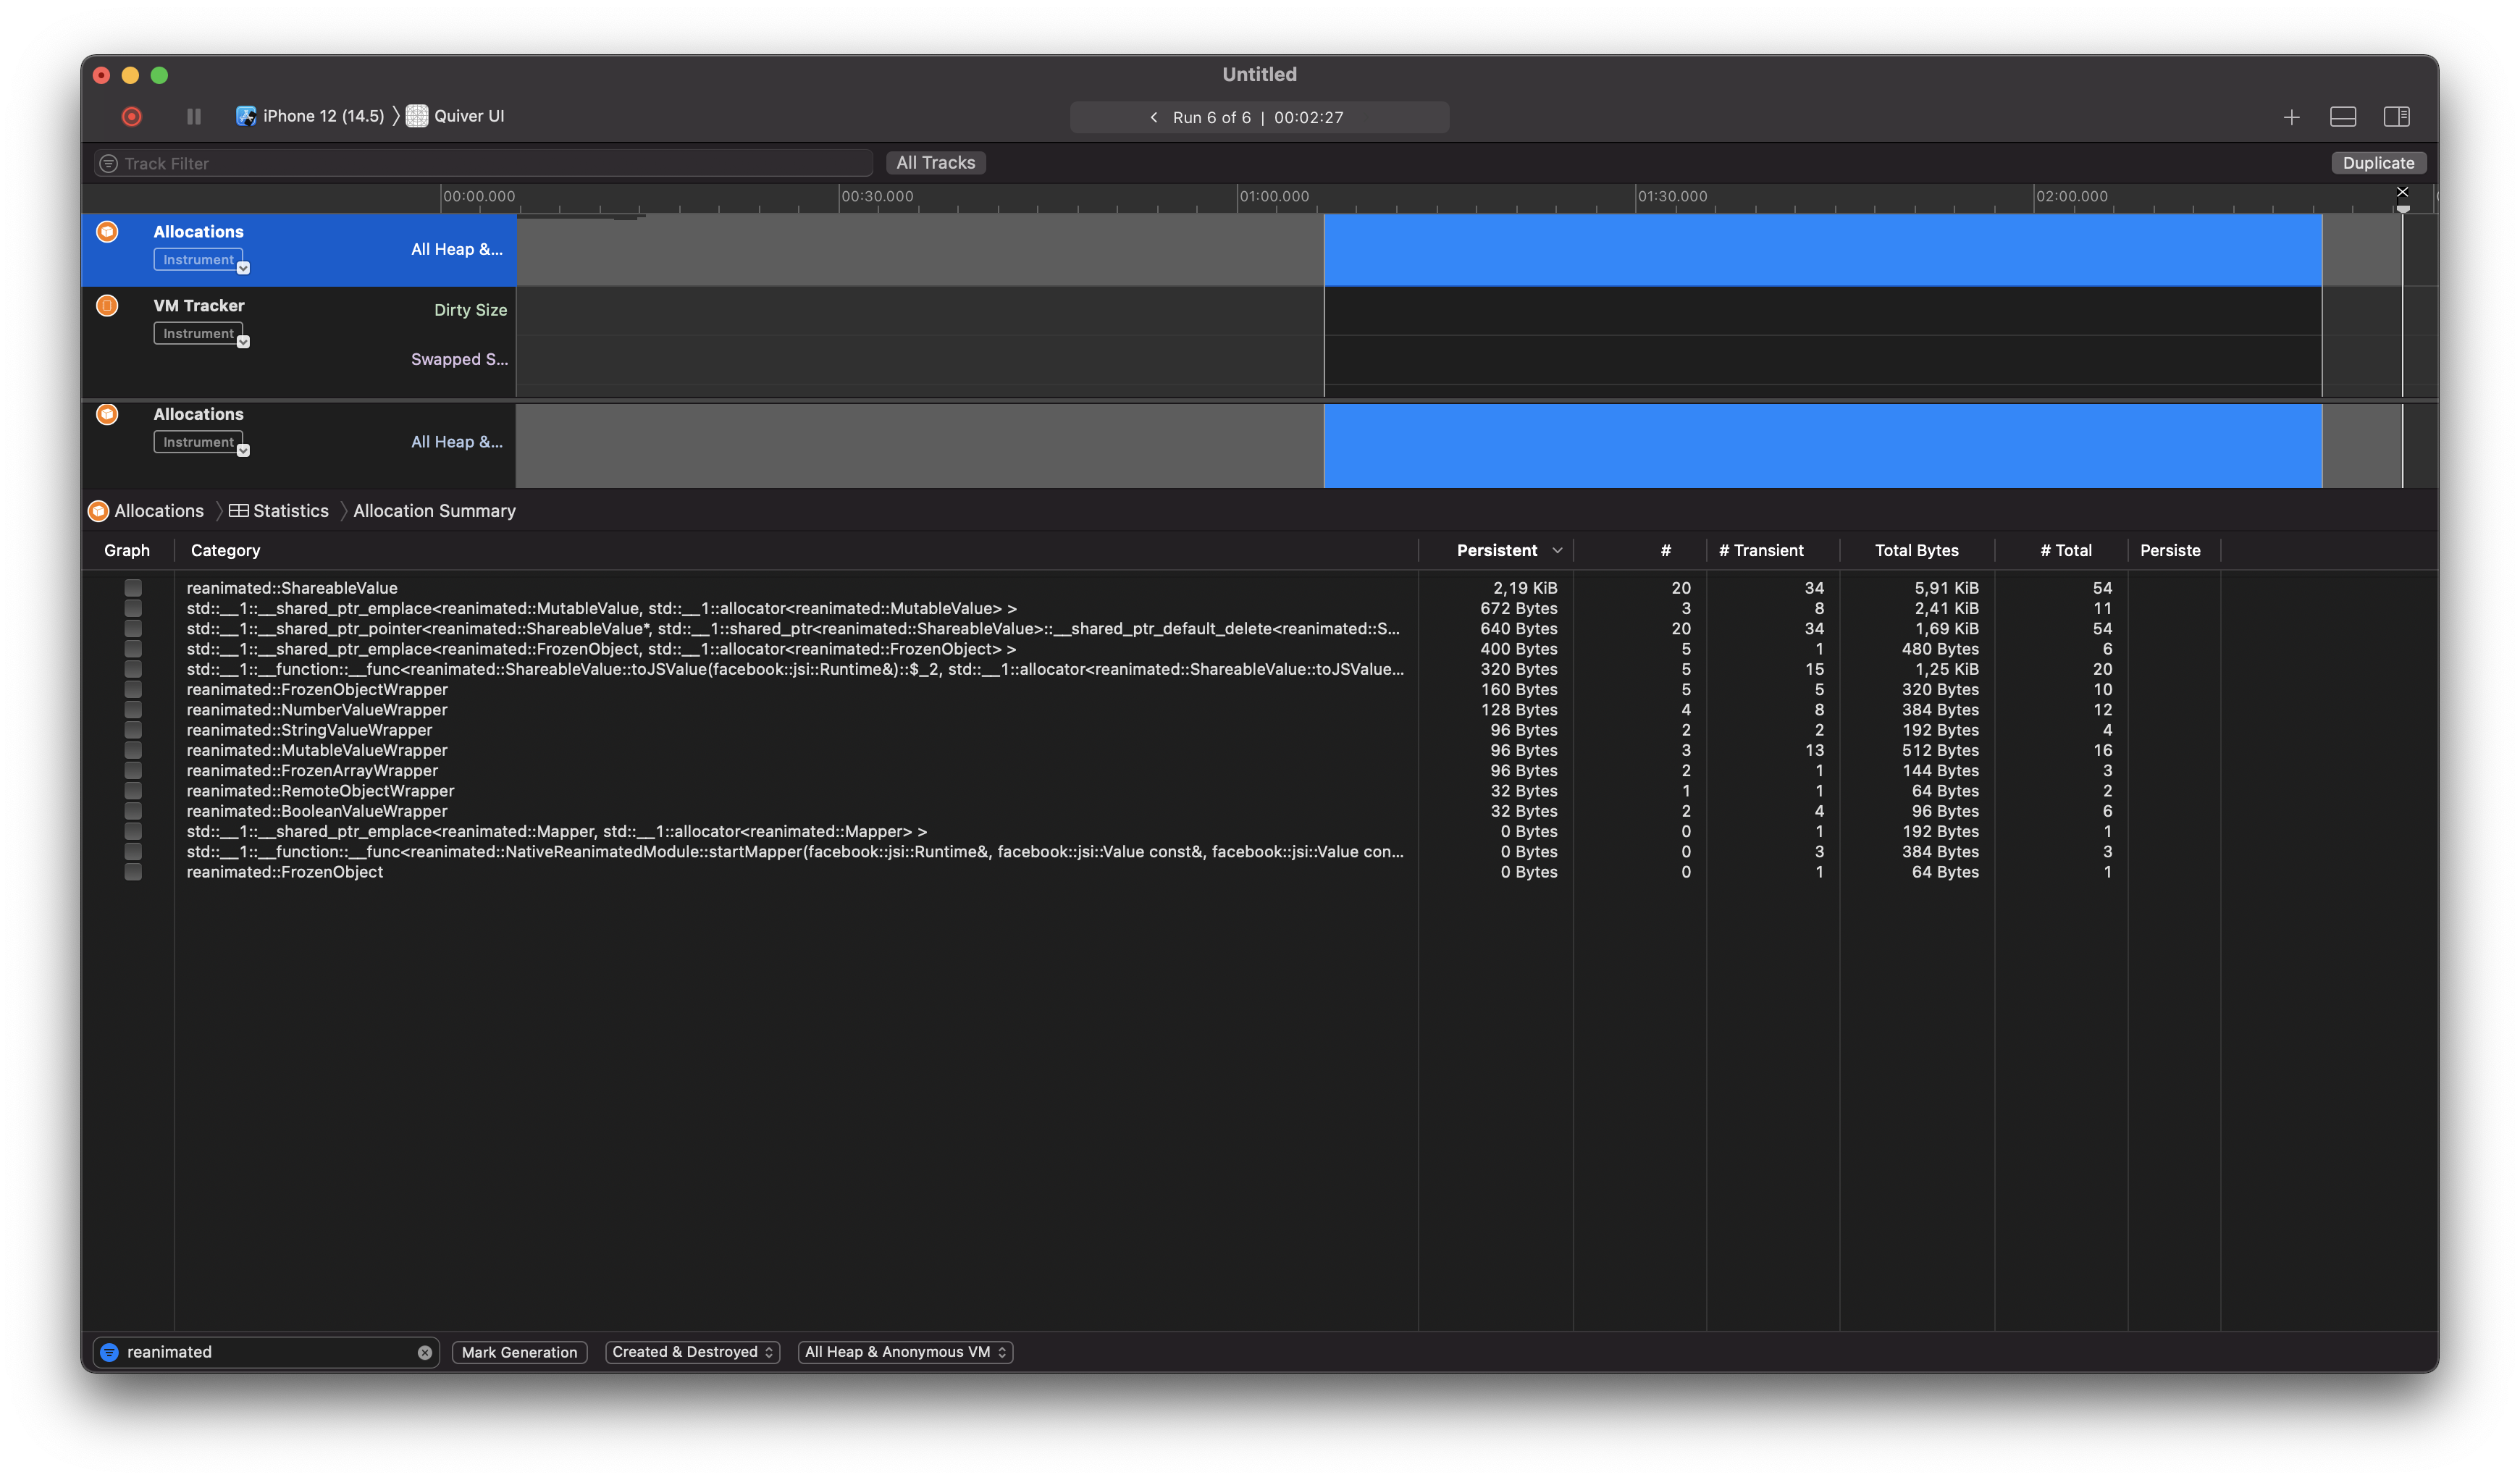
I've been looking into the problem with Instruments, and I want to share my measures.
This is a mount of one of our complicated components:
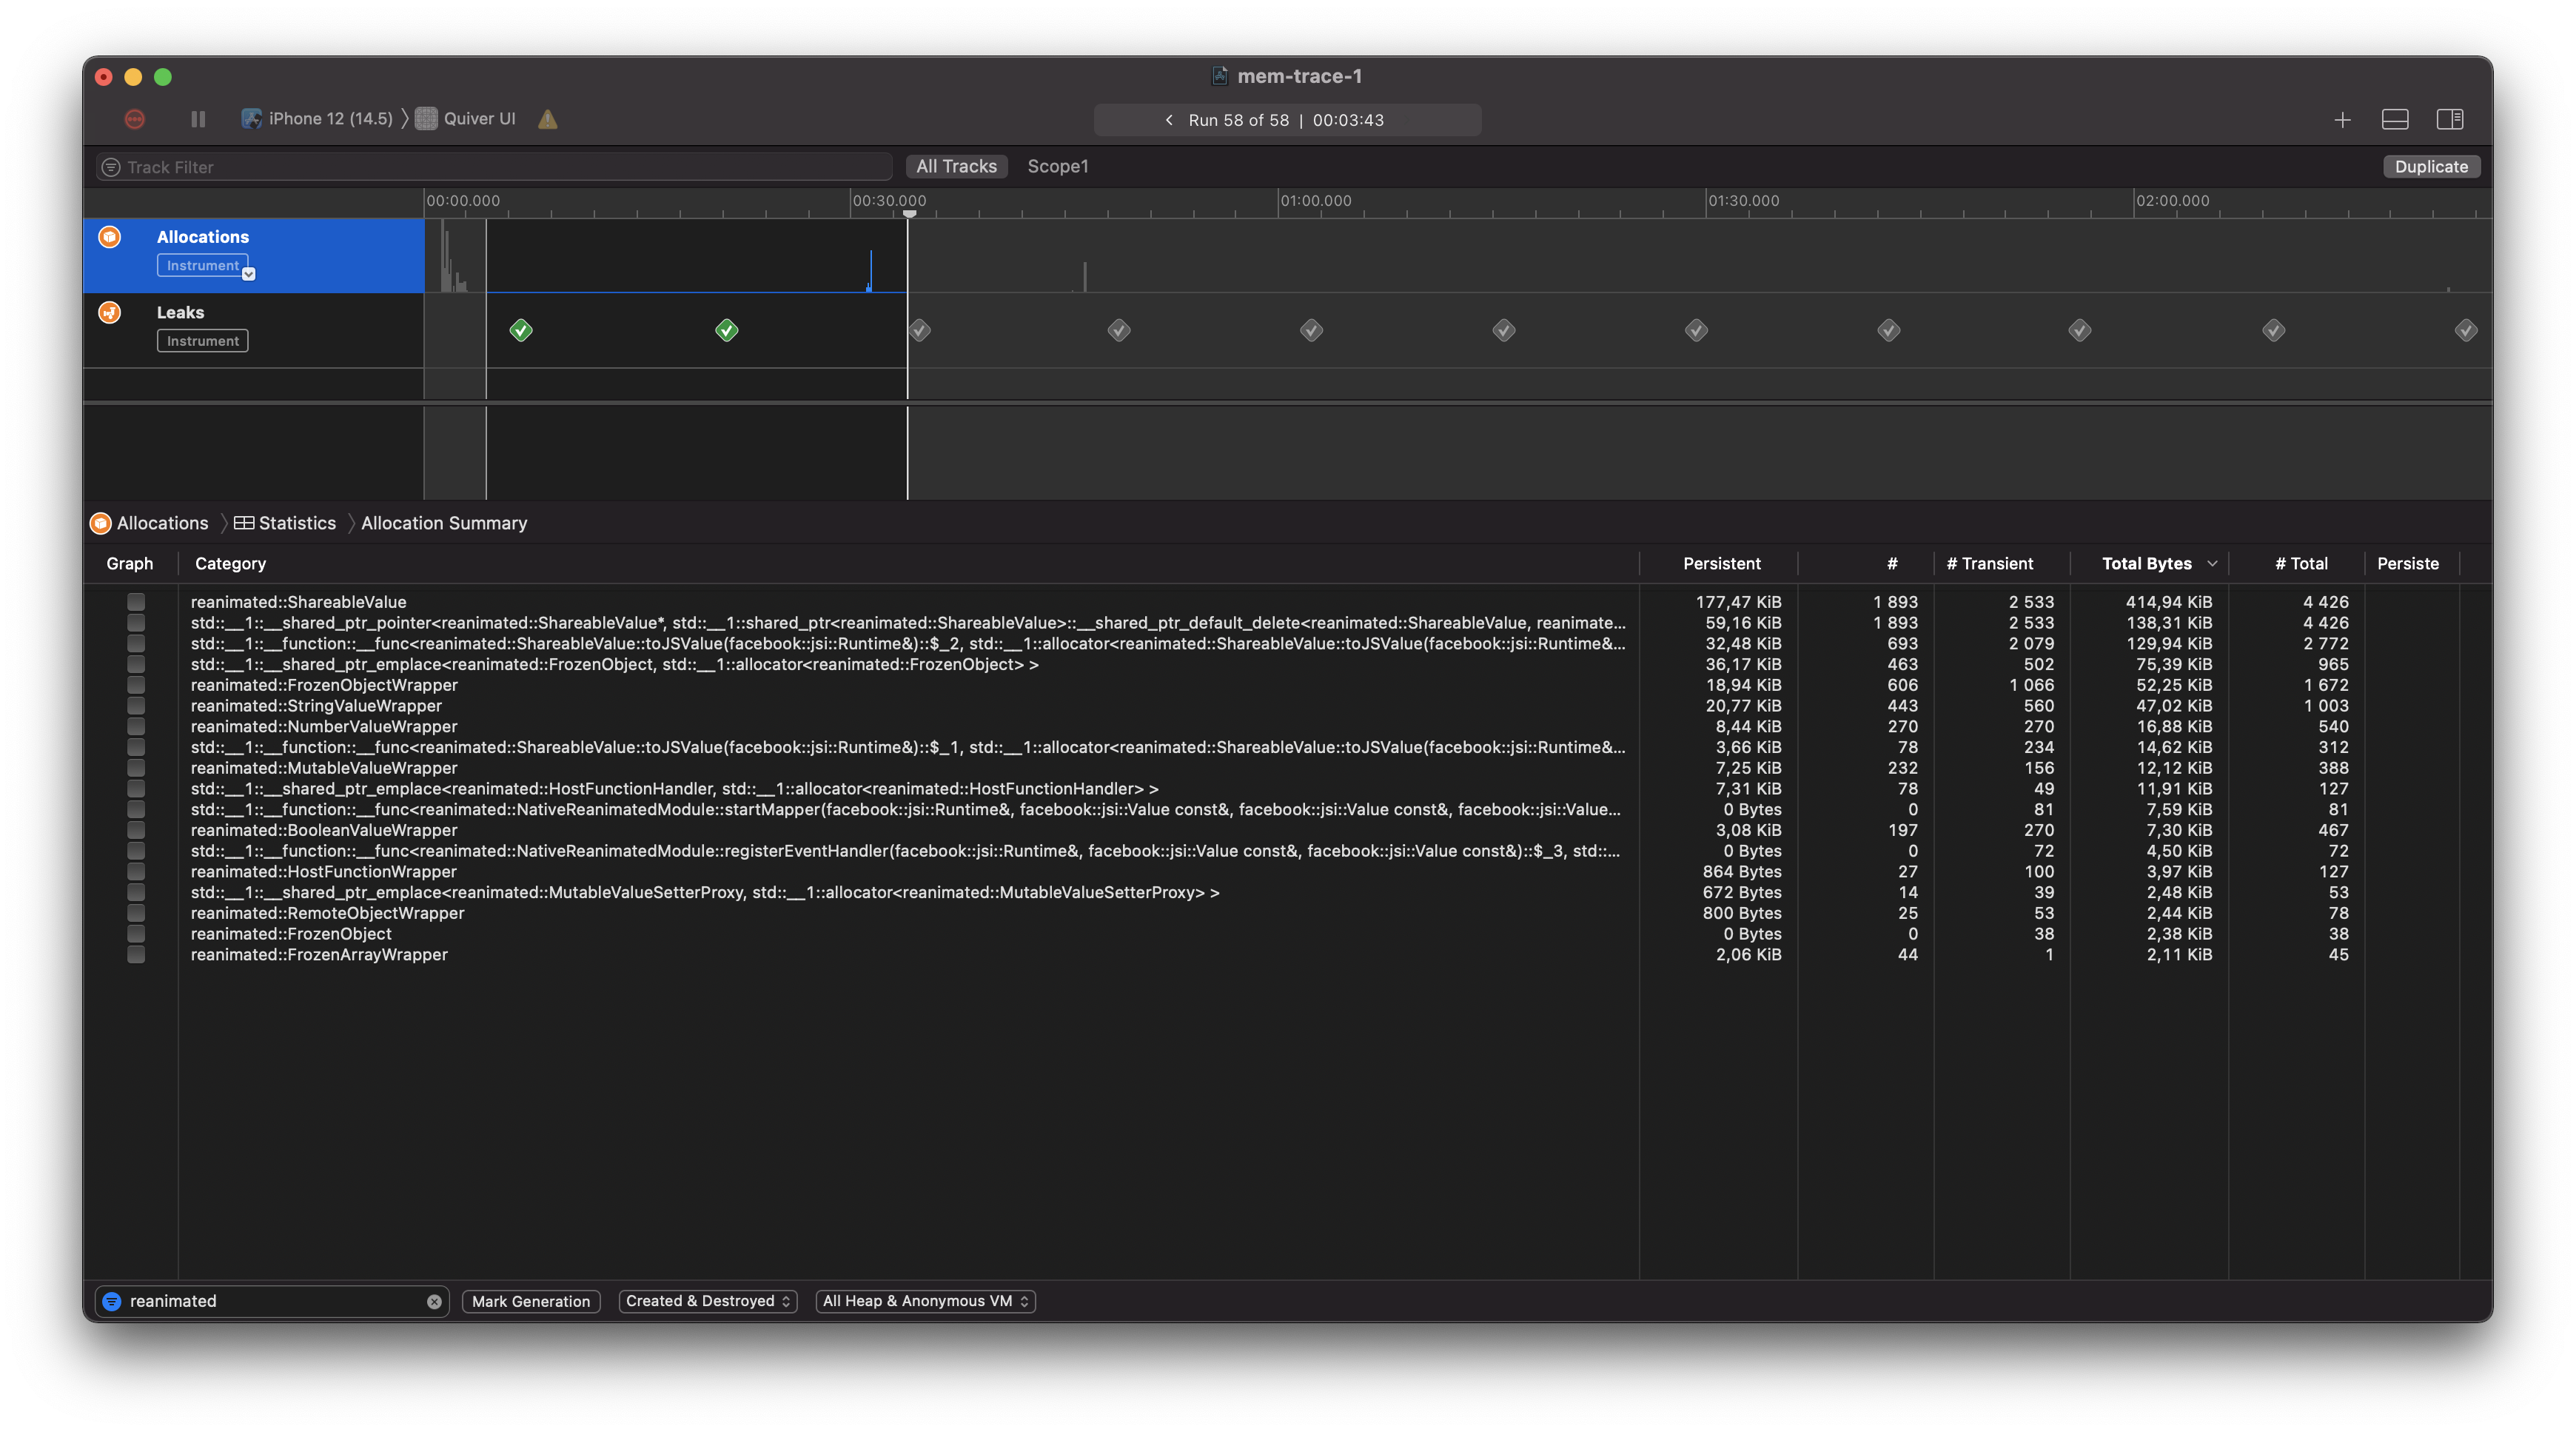
And this is what happens after unmount:
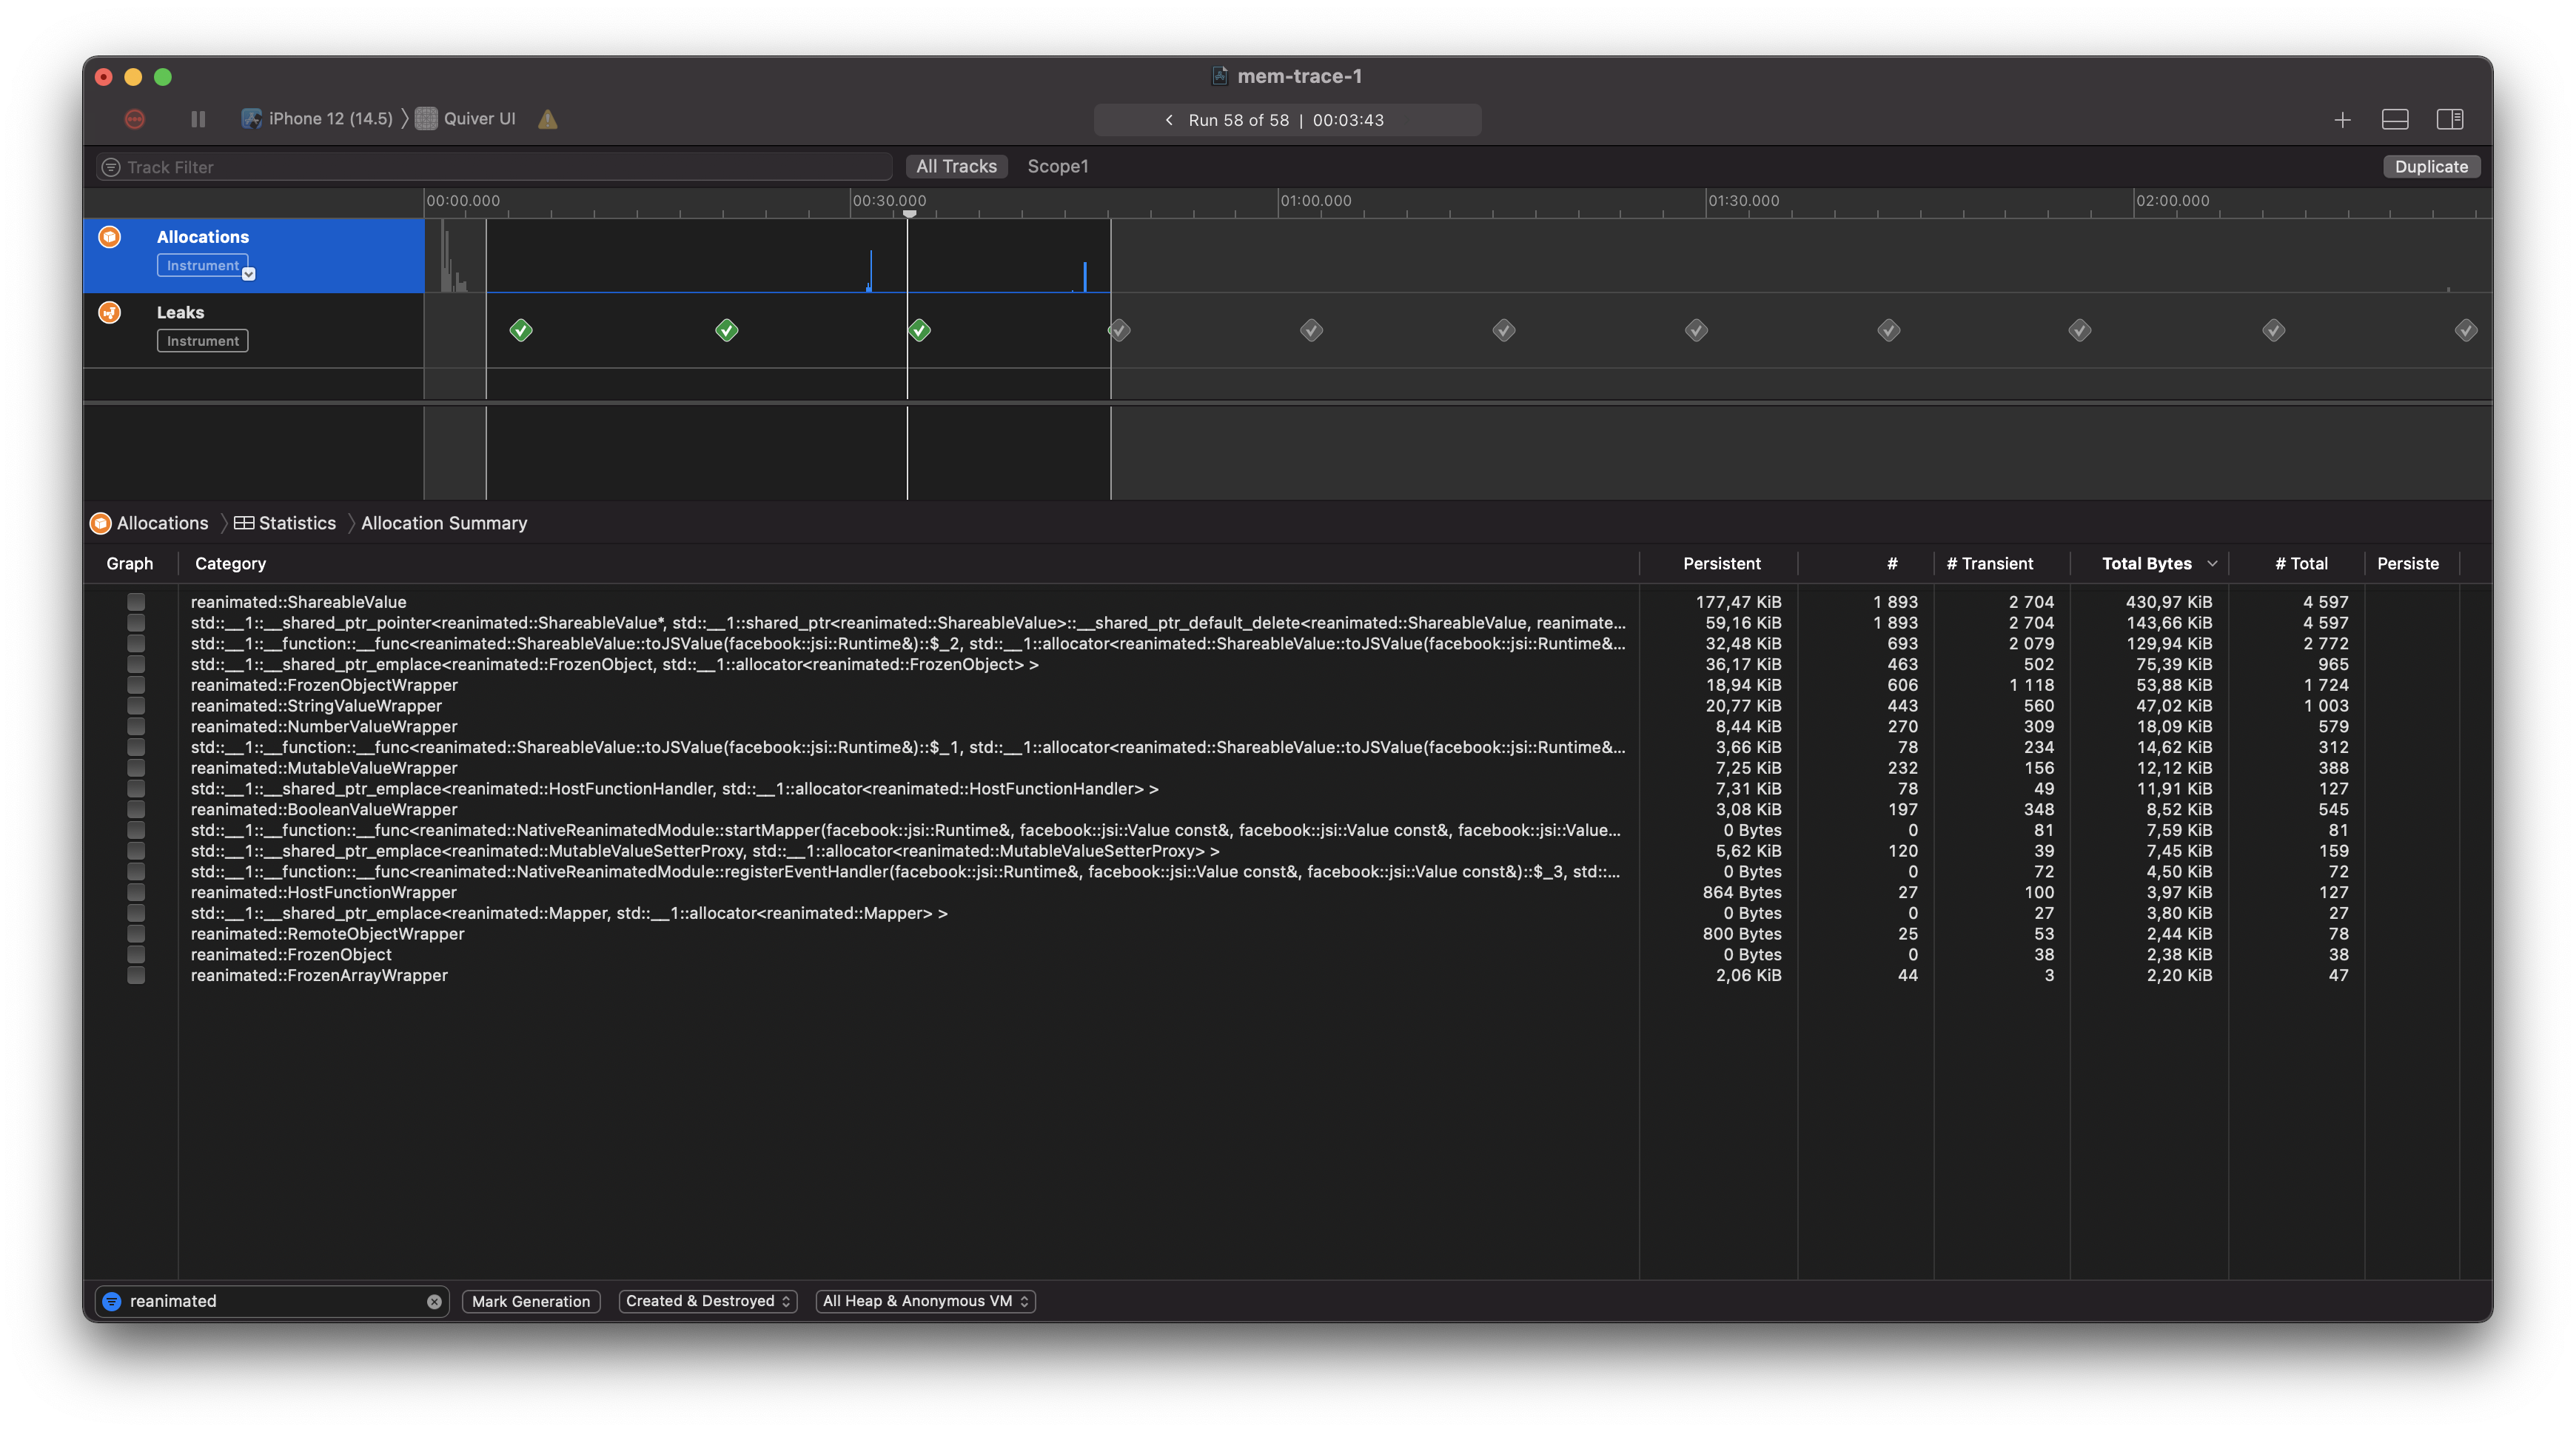
I've read about GC collection there and I personally was able to catch the point of GCing things with simple debugger breakpoint in ShereableValue deconstuctor, so I know that it's necessary to wait a minute or two, so there another snapshot:
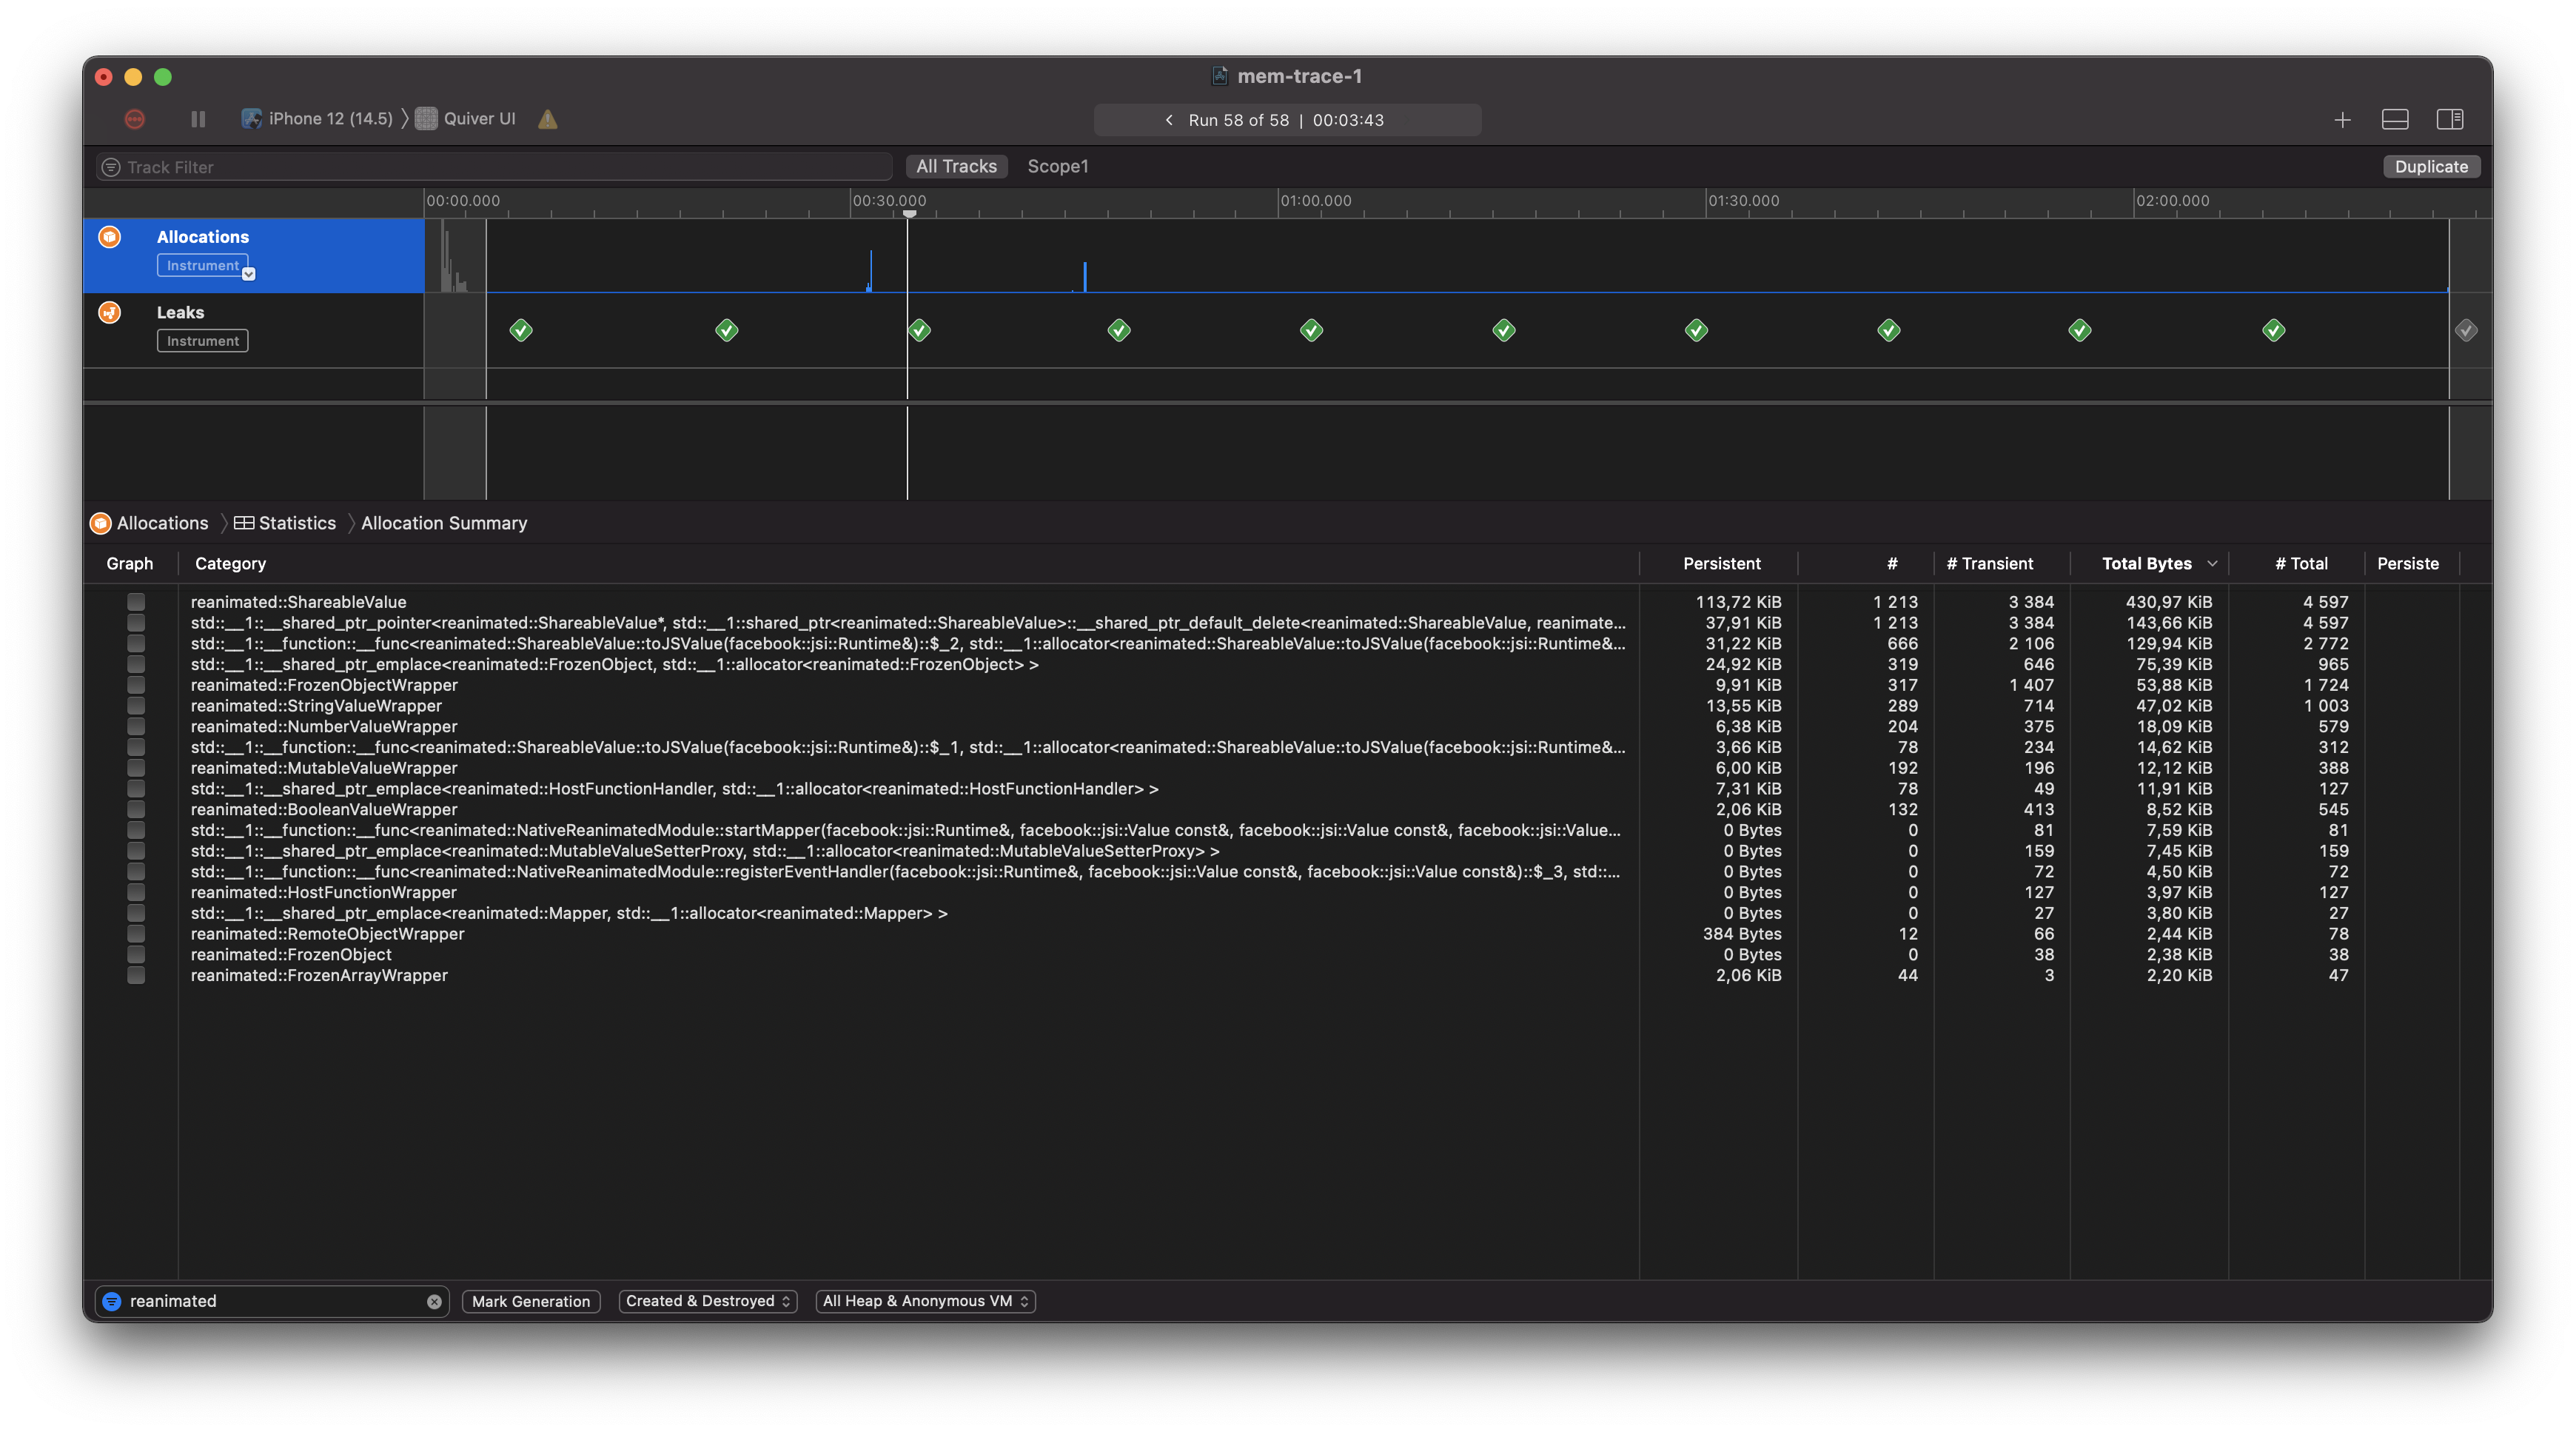
Moreover if I start to mount/unmount the same component, it seems that engine stops collection garbage from previous renders.
What worries me on this snapshots is this:
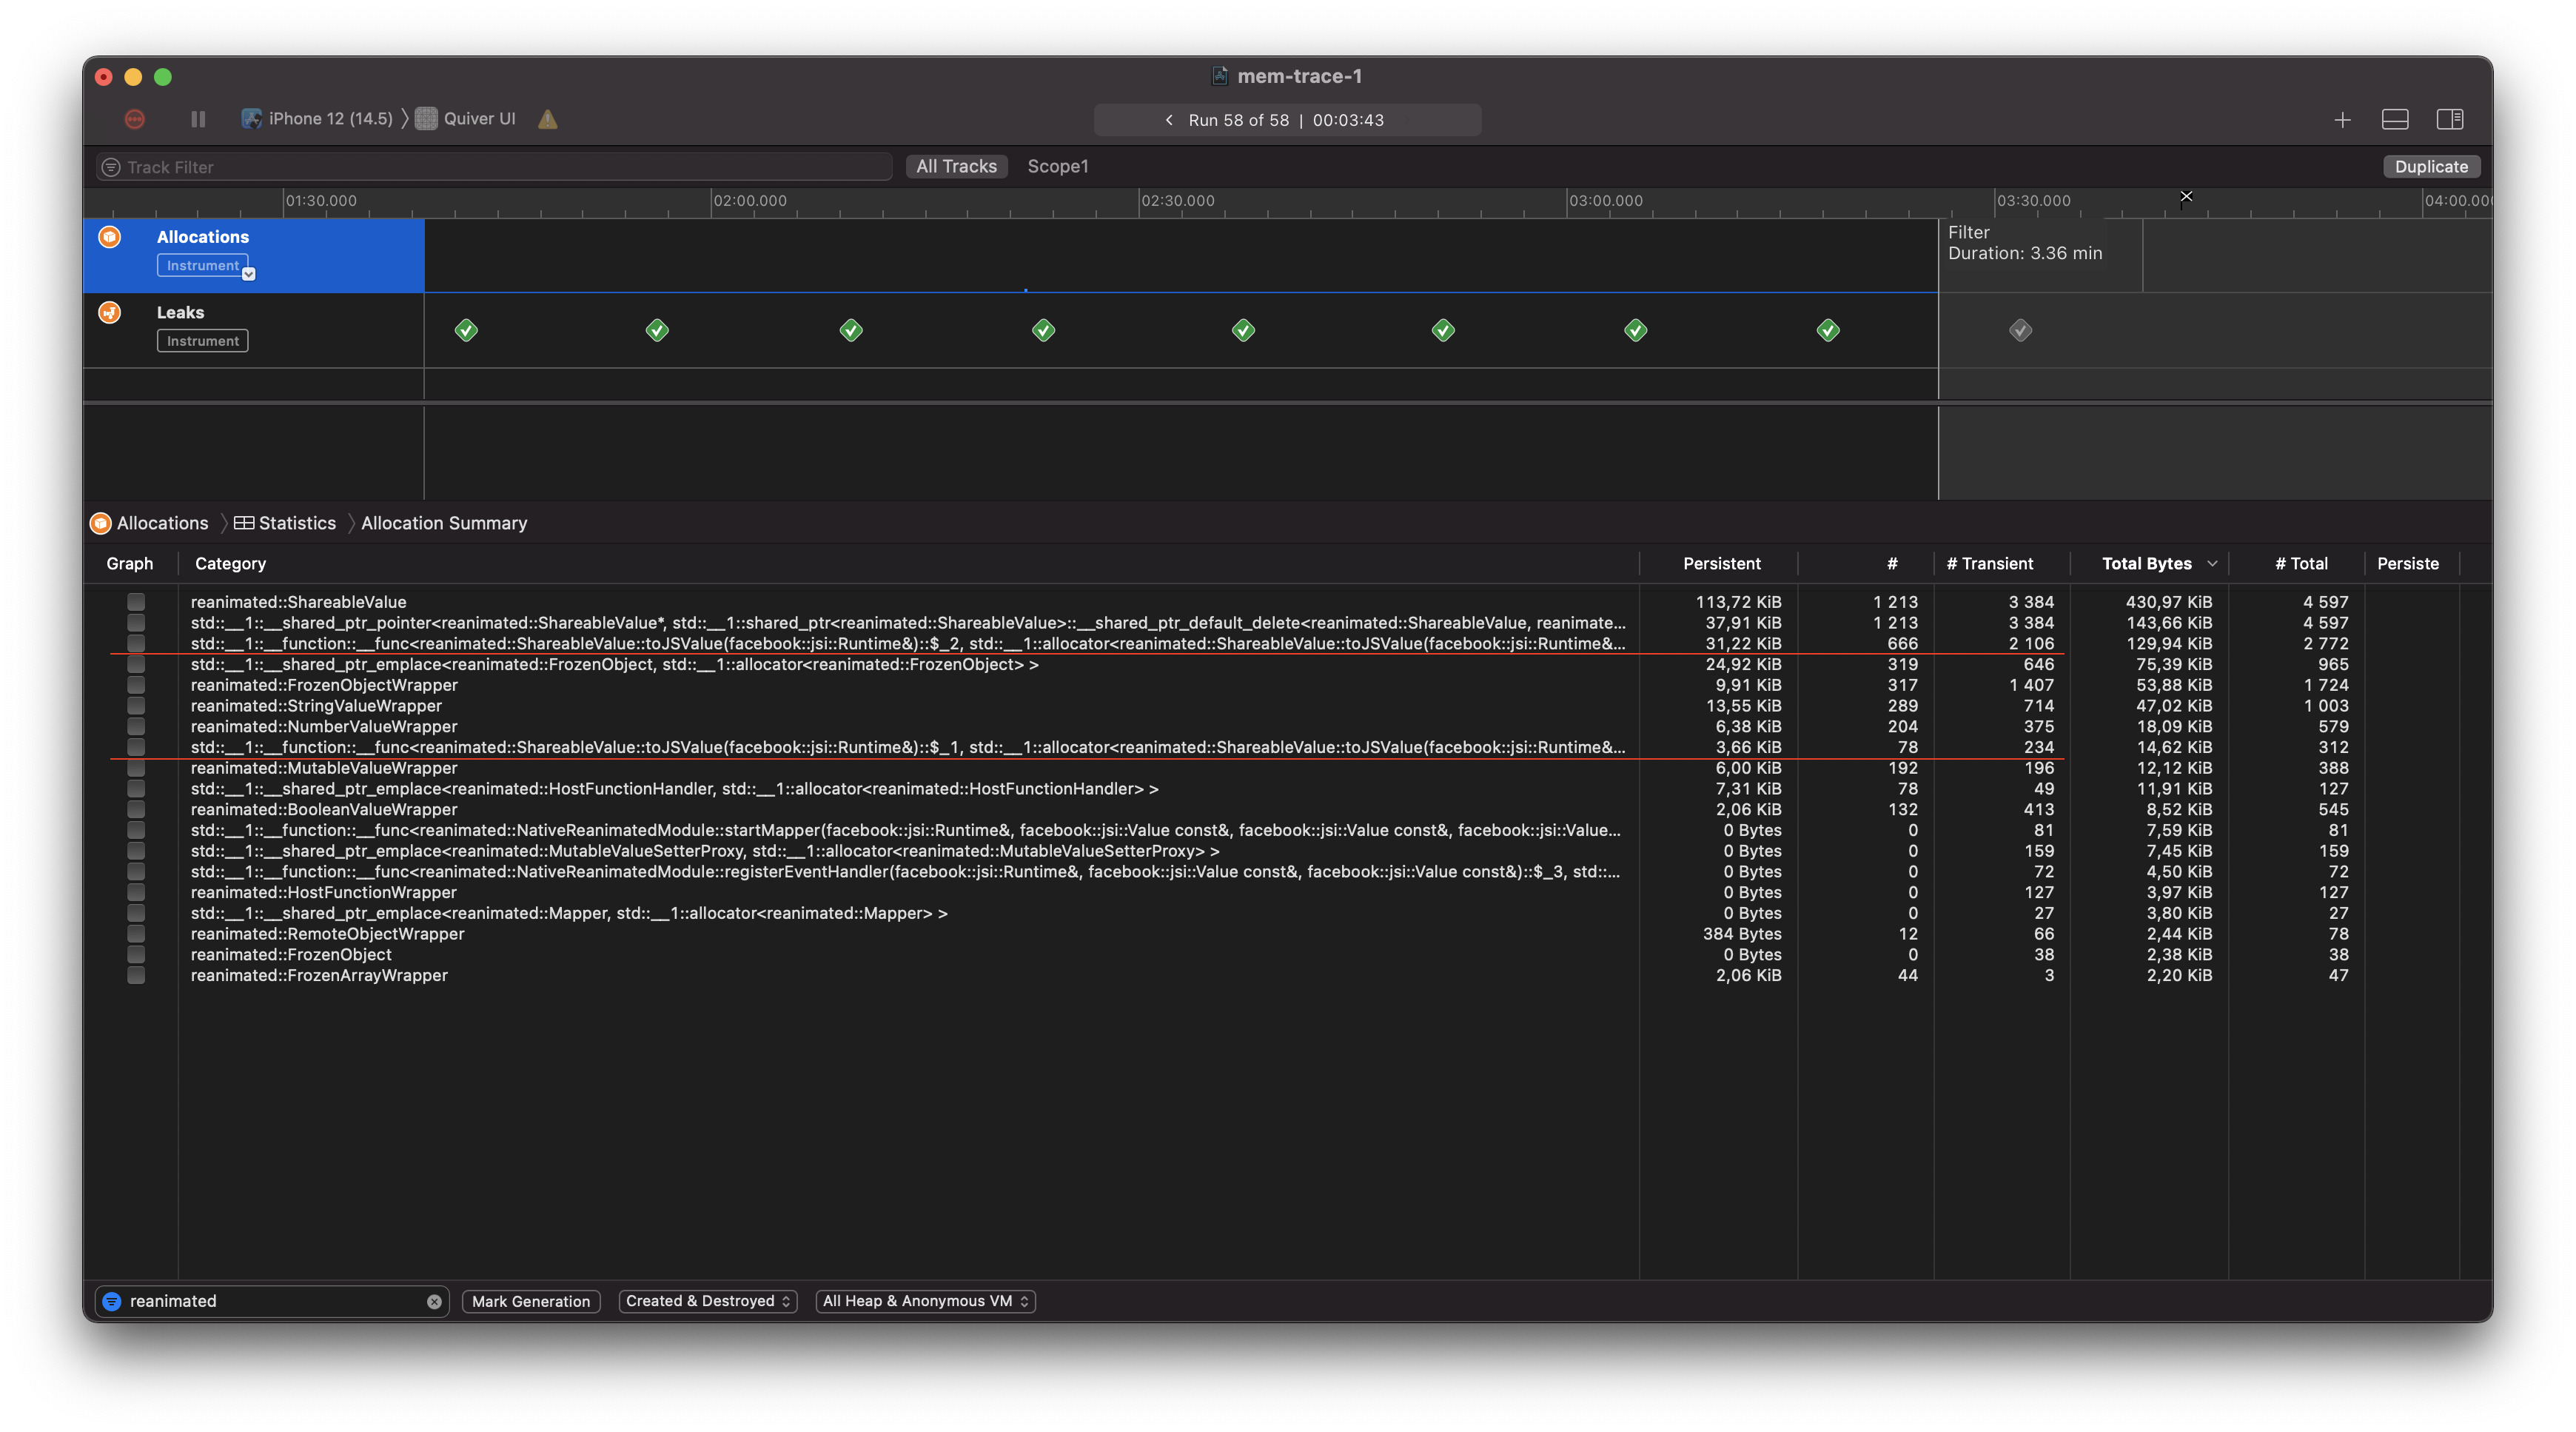
If I understand it correctly it's either worklets or host functions. What I can't understand is why there are so many of them. So it was a capture of one mount/unmount cycle, and I have around 30
useAnimatedStyleand fewuseAnimatedReactionin component. I can hardly imagine that it will produce more than 1k of refs.Do you guys have any ideas? Maybe I miss something? 🙏
Beta Was this translation helpful? Give feedback.
All reactions