-
|
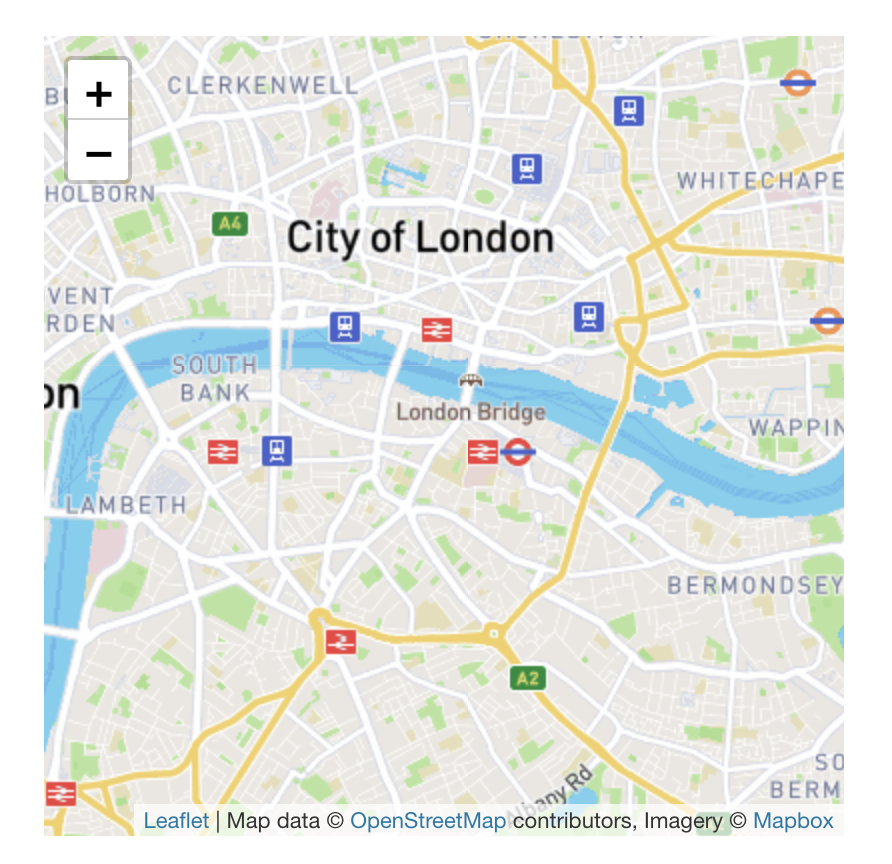
Hi all, thanks @squidfunk for making such a great tool. I'm currently trying to add a map to my docs page, something I was hoping would be relatively simple with Leaflet.js. The key components are two external files for css and js: To try and get this to work in mkdocs I created an # Outage Map
<div id="map"></div>
<script type="text/javascript">
var mymap = L.map('map').setView([51.505, -0.09], 13);
L.tileLayer('https://api.mapbox.com/styles/v1/{id}/tiles/{z}/{x}/{y}?access_token={accessToken}', {
attribution: 'Map data © <a href="https://www.openstreetmap.org/copyright">OpenStreetMap</a> contributors, Imagery © <a href="https://www.mapbox.com/">Mapbox</a>',
maxZoom: 18,
id: 'mapbox/streets-v11',
tileSize: 512,
zoomOffset: -1,
accessToken: 'pk.eyJ1IjoiZW5lcmd5dmlzIiwiYSI6ImNrbW9waTA3MjExaHMycG16eDM1b2pudGQifQ.qVmU0EfaBJRhN0Nrf1jvow'
}).addTo(mymap);
</script>And also added the css and js scripts to the extra_css and extra_js sections of the mkdocs.yml. No luck. I then tried to follow the instructions from this person who made a map successfully in mkdocs, first by manually adding the js to Any advice on how to get this working would be much appreciated! <!DOCTYPE html>
<html>
<head>
<meta charset="utf-8" />
<meta name="viewport" content="width=device-width, initial-scale=1.0, maximum-scale=1.0, user-scalable=no" />
<title>Raster Map Demo</title>
<link rel="stylesheet" href="https://unpkg.com/[email protected]/dist/leaflet.css"
integrity="sha512-xodZBNTC5n17Xt2atTPuE1HxjVMSvLVW9ocqUKLsCC5CXdbqCmblAshOMAS6/keqq/sMZMZ19scR4PsZChSR7A=="
crossorigin=""/>
<script src="https://unpkg.com/[email protected]/dist/leaflet.js"
integrity="sha512-XQoYMqMTK8LvdxXYG3nZ448hOEQiglfqkJs1NOQV44cWnUrBc8PkAOcXy20w0vlaXaVUearIOBhiXZ5V3ynxwA=="
crossorigin=""></script>
<style type="text/css">
html, body, #map {
    width: 100%;
    height: 100%;
    margin: 0;
}
</style>
</head>
<body >
<div id="map"></div>
<script type="text/javascript">
var mymap = L.map('map').setView([51.505, -0.09], 13);
L.tileLayer('https://api.mapbox.com/styles/v1/{id}/tiles/{z}/{x}/{y}?access_token={accessToken}', {
attribution: 'Map data © <a href="https://www.openstreetmap.org/copyright">OpenStreetMap</a> contributors, Imagery © <a href="https://www.mapbox.com/">Mapbox</a>',
maxZoom: 18,
id: 'mapbox/streets-v11',
tileSize: 512,
zoomOffset: -1,
accessToken: 'pk.eyJ1IjoiZW5lcmd5dmlzIiwiYSI6ImNrbW9waTA3MjExaHMycG16eDM1b2pudGQifQ.qVmU0EfaBJRhN0Nrf1jvow'
}).addTo(mymap);
</script>
</body>
</html> |
Beta Was this translation helpful? Give feedback.
Replies: 2 comments 4 replies
-
|
The Running your code after the document has been fully loaded by awaiting for <div id="map"></div>
<script type="text/javascript">
document.addEventListener("DOMContentLoaded", function() {
var mymap = L.map('map').setView([51.505, -0.09], 13);
L.tileLayer('https://api.mapbox.com/styles/v1/{id}/tiles/{z}/{x}/{y}?access_token={accessToken}', {
attribution: 'Map data © <a href="https://www.openstreetmap.org/copyright">OpenStreetMap</a> contributors, Imagery © <a href="https://www.mapbox.com/">Mapbox</a>',
maxZoom: 18,
id: 'mapbox/streets-v11',
tileSize: 512,
zoomOffset: -1,
accessToken: 'pk.eyJ1IjoiZW5lcmd5dmlzIiwiYSI6ImNrbW9waTA3MjExaHMycG16eDM1b2pudGQifQ.qVmU0EfaBJRhN0Nrf1jvow'
}).addTo(mymap);
})
</script> |
Beta Was this translation helpful? Give feedback.
-
|
Quick mention that I cannot access https://groups.google.com/g/mkdocs/c/qvwXYRuDM-M for some reason. Trying to figure out what the override you did for the head tags and how it was done. edit: Figured it out. In case anyone want to learn how I did it, you can look at this commit electron-workshop/electronworkshop.com.au@cb90bca Main thing is to change extra_css:
- https://unpkg.com/[email protected]/dist/leaflet.css
extra_javascript:
- https://unpkg.com/[email protected]/dist/leaflet.jsAnd in the template home.html in my case, I've added this in <section id="activity-map-container" class="mdx-container">
<div id="activity-map-card" class="mdx-hero md-typeset">
<h1 id="activity-map-title">Activity Map</h1>
<p id="activity-map-subtitle">Map of recent activities</p>
<div class="leaflet-container" id="map" style="width: 800px; height: 700px; margin: 0;"></div>
</div>
</section>
<script>
document.addEventListener("DOMContentLoaded", function() {
const map = L.map('map').setView([-27.41, 134.77], 3);
const tiles = L.tileLayer('https://tile.openstreetmap.org/{z}/{x}/{y}.png', {
maxZoom: 19,
attribution: '© <a href="http://www.openstreetmap.org/copyright">OpenStreetMap</a>'
}).addTo(map);
// Function to calculate fade based on post date
function getFadeRatioBasedOnTime(postDateStr) {
const postDate = new Date(postDateStr);
const currentDate = new Date();
const oneYear = 365 * 24 * 60 * 60 * 1000; // milliseconds in one year
const timeDiff = currentDate - postDate;
const fadeRatio = Math.min(timeDiff / oneYear, 1); // Ensure it doesn't exceed 1
return fadeRatio;
}
// Add blog activity map
var myFGMarker = new L.FeatureGroup();
{%- for file in pages %}
{%- if file.page.meta.geo %}
{
var marker = L.marker([{{file.page.meta.geo.latitude}}, {{file.page.meta.geo.longitude}}], {opacity: 1.0-getFadeRatioBasedOnTime('{{ file.page.meta.date }}')/2})
.bindPopup('<a style="font-weight:bold" href="{{ file.page.url }}">{{ file.page.title }}</a> <br/> {{ file.page.meta.date }} <br/> {{file.page.meta.geo.name}} <br/> {{file.page.meta.geo.address}}');
myFGMarker.addLayer(marker);
}
{%- endif %}
{%- endfor %}
map.addLayer(myFGMarker);
map.fitBounds(myFGMarker.getBounds(), {padding: [50, 50]});
});
</script>In the blog post (am using the blog plugin) I added this front matter geo:
address: Sheraton Grand Hyde Park.
161 Elizabeth Street
Sydney NSW.
latitude: '-33.8715236'
longitude: '151.2072446'
name: 'Sheraton Grand Hyde Park'Also added this css .leaflet-container {
height: 400px;
width: 600px;
max-width: 100%;
max-height: 100%;
}Hope that provides some extra pointers to others. In my case I was creating a geographical activity map. |
Beta Was this translation helpful? Give feedback.

The
extra_javascriptsection is included after the JavaScript of Material for MkDocs and after the content, so I think the problem might be related to your JavaScript running before the Leaflet library is available. Other than that, your code looks correct.Running your code after the document has been fully loaded by awaiting for
DOMContentLoadedmight do the trick: