-
|
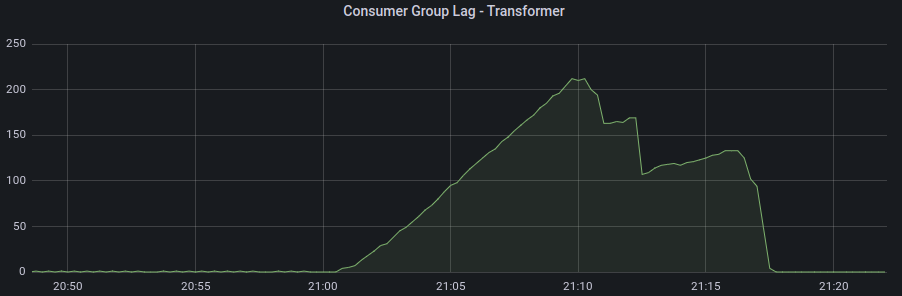
I am trying to diagnose why I am having some consumers hanging and not processing messages per the plot below:
Which I think might be related to the error showing up when I describe my kafka deployment, specifically Output of kubectl kafka describe .... When the lag happens in the consumer group, I am getting these logs as well (error starts at ~2022-06-10 02:02:52): Broker 2 / 3 (similar logs) Kafka manifest: apiVersion: kafka.strimzi.io/v1beta2
kind: Kafka
metadata:
name: "icon-kafka-mainnet-v2-a"
namespace: "icon-kafka-mainnet-v2"
annotations:
"consul.hashicorp.com/connect-inject": "true"
"consul.hashicorp.com/connect-service-port": "9092"
spec:
cruiseControl:
metricsConfig:
type: jmxPrometheusExporter
valueFrom:
configMapKeyRef:
name: cruise-control-metrics
key: metrics-config.yml
kafka:
template:
pod:
priorityClassName: "system-cluster-critical"
affinity:
nodeAffinity:
requiredDuringSchedulingIgnoredDuringExecution:
nodeSelectorTerms:
- matchExpressions:
- key: vke.vultr.com/node-pool
operator: In
values:
- "kafka-mainnet-v2"
- key: pv.capacity
operator: NotIn
values:
- full
podAntiAffinity:
requiredDuringSchedulingIgnoredDuringExecution:
- labelSelector:
matchExpressions:
- key: strimzi.io/name
operator: In
values:
- "icon-kafka-mainnet-v2-a-kafka"
topologyKey: "kubernetes.io/hostname"
resources:
requests:
cpu: 100m
memory: 5Gi
limits:
cpu: 2.5
memory: 6.5Gi
jvmOptions:
"-XX":
"MetaspaceSize": "96m"
"UseG1GC": true
"MaxGCPauseMillis": "20"
"InitiatingHeapOccupancyPercent": "35"
"G1HeapRegionSize": "16M"
"MinMetaspaceFreeRatio": "50"
"MaxMetaspaceFreeRatio": "80"
metricsConfig:
type: jmxPrometheusExporter
valueFrom:
configMapKeyRef:
name: "icon-kafka-mainnet-v2-a-kafka-metrics"
key: kafka-metrics-config.yml
version: 3.1.0
replicas: 3
listeners:
- name: plain
port: 9092
type: internal
tls: false
- name: tls
port: 9093
type: internal
tls: true
config:
replica.selector.class: org.apache.kafka.common.replica.RackAwareReplicaSelector
offsets.topic.replication.factor: 3
transaction.state.log.replication.factor: 3
transaction.state.log.min.isr: 2
log.message.format.version: "2.8"
inter.broker.protocol.version: "2.8"
auto.create.topics.enable: "false"
delete.topic.enabled: "true"
message.max.bytes: "67109632"
replica.fetch.max.bytes: "67109632"
replica.fetch.response.max.bytes: "67109632"
storage:
type: jbod
volumes:
- id: 0
type: persistent-claim
size: "200Gi"
deleteClaim: true
class: "vultr-block-storage-wait-retain"
- id: 1
type: persistent-claim
size: "200Gi"
deleteClaim: true
class: "vultr-block-storage-wait-retain"
zookeeper:
template:
pod:
affinity:
nodeAffinity:
requiredDuringSchedulingIgnoredDuringExecution:
nodeSelectorTerms:
- matchExpressions:
- key: vke.vultr.com/node-pool
operator: In
values:
- "kafka-mainnet-v2"
- key: pv.capacity
operator: NotIn
values:
- full
podAntiAffinity:
requiredDuringSchedulingIgnoredDuringExecution:
- labelSelector:
matchExpressions:
- key: strimzi.io/name
operator: In
values:
- "icon-kafka-mainnet-v2-a-zookeeper"
topologyKey: "kubernetes.io/hostname"
resources:
requests:
cpu: 100m
memory: 250Mi
limits:
cpu: 500m
memory: 1Gi
replicas: 3
storage:
type: persistent-claim
size: "10Gi"
deleteClaim: true
class: "vultr-block-storage-wait-retain"
kafkaExporter:
topicRegex: ".*"
groupRegex: ".*"
entityOperator:
topicOperator: {}
userOperator: {}And finally the topic manifest: apiVersion: kafka.strimzi.io/v1beta1
kind: KafkaTopic
metadata:
name: "blocks-mainnet-v2"
namespace: "icon-kafka-mainnet-v2"
labels:
strimzi.io/cluster: "icon-kafka-mainnet-v2-a"
spec:
replicas: 3
partitions: 24
config:
retention.ms: "-1"
retention.bytes: "-1"
segment.bytes: 1073741824
cleanup.policy: compact
min.cleanable.dirty.ratio: 0.5
max.message.bytes: 67109632 # 1048588 (default - 1 mb) * 64Any input much appreciated. Happy to follow up with any other information. |
Beta Was this translation helpful? Give feedback.
Replies: 3 comments 3 replies
-
|
Kafka does not handle well when it runs out of space. So if it did, the brokers will get into some error states. The easiest way how to get out of it is by either increasing the storage (which how aware usually cannot be decreased again later) or by deleting some of the older segments. (assuming the no spece left on the device comes from Kafka) |
Beta Was this translation helpful? Give feedback.
-
|
@scholzj - Thank you very much for the answer. I ended up redeploying the cluster which made the "No space left on device" error go away but I am still getting the same behavior with the consumers hanging. I am getting a warning though in the kafka resource: Could this be related or is there anything else I should be looking for in my config?
Thank you for your time. |
Beta Was this translation helpful? Give feedback.
-
|
The warning suggests that any topics created with the default settings will have only 1 replica which means no high-availability, no protection against data loss etc. But it is just the default setting. It might not say much about the actual topics which might use their own settings. You can get rid of it by setting the defaults: https://github.com/strimzi/strimzi-kafka-operator/blob/main/examples/kafka/kafka-persistent.yaml#L18-L24 If you would have topcis with single replica only, it would of course affect your consumers in case of any broker restarts, outages etc. That said, the consume lag screenshot looks good to me? It shows that you have 0 lag. So if there is any issue with the consumer not getting any messages, maybe producer is not sending them? |
Beta Was this translation helpful? Give feedback.
-
|
So I had most of those settings for replication on the topic level so I guess I could ignore those errors. I did miss some settings from the Going to watch this for a day and see if the behavior goes away. Again, thank you for your time. |
Beta Was this translation helpful? Give feedback.
-
|
I mean it shows that there was some lag. But at the moment you took the screenshot it was all gone. I do not know your use-case or your cluster. It is normal that there is some lag, especially at peak times if you have some traffic in your cluster. Also, the consumer might be doing some blocking processing and commit the offsets only in chunks. So without some additional information about throughput and the design of the consumer, it is hard to say what the cause might be. |
Beta Was this translation helpful? Give feedback.
-
|
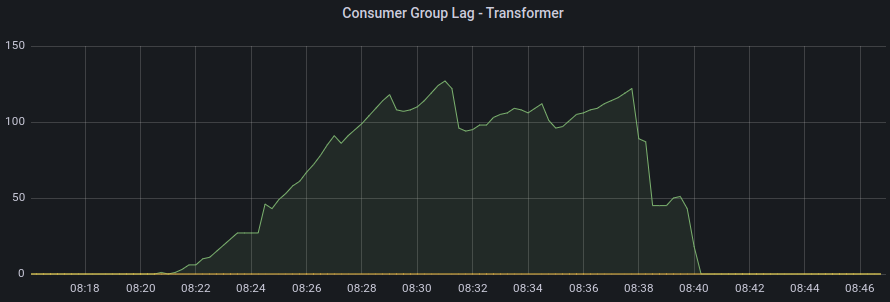
Just following up on this, problem of having some consumer lag has not completely gone away but is now not nearly as bad as it was before. Not sure what exact configuration setting you @scholzj recommended had the most impact, but one of them from Thanks again for your help. |
Beta Was this translation helpful? Give feedback.
Just following up on this, problem of having some consumer lag has not completely gone away but is now not nearly as bad as it was before. Not sure what exact configuration setting you @scholzj recommended had the most impact, but one of them from
kafka-persistent.yamlmade a difference.Thanks again for your help.