Exposing Debezium plugin JMX metrics on kafka connect cluster in Strimzi #7914
Replies: 8 comments 16 replies
-
|
Have you tried to not mix the conflicting configurations and add just the |
Beta Was this translation helpful? Give feedback.
-
|
I can look at the operator logs. I did try just deploying the debezium rules. I also tried deploying with no rules so that it should expose everything available. But no luck. |
Beta Was this translation helpful? Give feedback.
-
|
I get the feeling this issue is to niche/vague for anyone to necessarily help with, I did look at operator logs, and kafka connect cluster logs, with the debug log level, but didn't find any logs related to JMX or those metrics |
Beta Was this translation helpful? Give feedback.
-
|
I guess the question is whether you have no exceptions in the operator logs and whether your KafkaConnect CR is ready and has the |
Beta Was this translation helpful? Give feedback.
-
|
Hi @davidnateberg : I am working on the same stuff and have come across the exact same issue. In my case everything seems to be running normally ie |
Beta Was this translation helpful? Give feedback.
-
|
@ee07dazn well that makes me feel a little better! I've been banging my head against the wall with this issue for days. At this point I've given up on Debezium metrics because I needed to get moving on our deployment, at least having the kafka connect metrics is nice. I tried deploying with only the Debezium config, however, I truly don't think it is an issue with the metrics config. I have deployed with the following pattern which shouldn't filter out any metrics, so anything thats exposed should be visible, including Debezium. But there are no debezium metrics if I which sets this env variable but doesn't set any of the other environment variables that Debezium claims to require to expose metrics, i.e. I don't know if that's related, I'm really at a loss here |
Beta Was this translation helpful? Give feedback.
-
I'm not sure what do you mean with being considered bare metal. Strimzi runs on Kubernetes. You have two options in Strimzi's Kafka Connect:
In neither of those ways are you expected to set any environment variables. You just configure the custom resources. I'm afraid I do not know how it is implemented in Debezium -> there is no real metrics unification for Kafka Connect connectors. That is currently only proposed in KIP-877. But right now it is up to each connector. |
Beta Was this translation helpful? Give feedback.
-
Yeah it was kind of a silly question. But I was just trying to sus out which set of env variables would be appropriate based on the Debezium docs I linked. Those docs reference a specific docker image for debezium and tell you which env variables need to be set to expose metrics for that plugin. As a theory I thought maybe those have to be set on the Kafka connect pod to properly expose the plug-in metrics. I have set the config as you mentioned using the connect CR. It works as expected but only seems to expose Kafka connect metrics and metrics for plugins. This is not necessarily Debezium specific. At least I don't think so. But I understand it's a random plug-in, and I wouldn't expect you to troubleshoot that. But I guess I would be curious if there's any examples of people exposing other metrics from plugins besides the Kafka connect metrics. |
Beta Was this translation helpful? Give feedback.
-
|
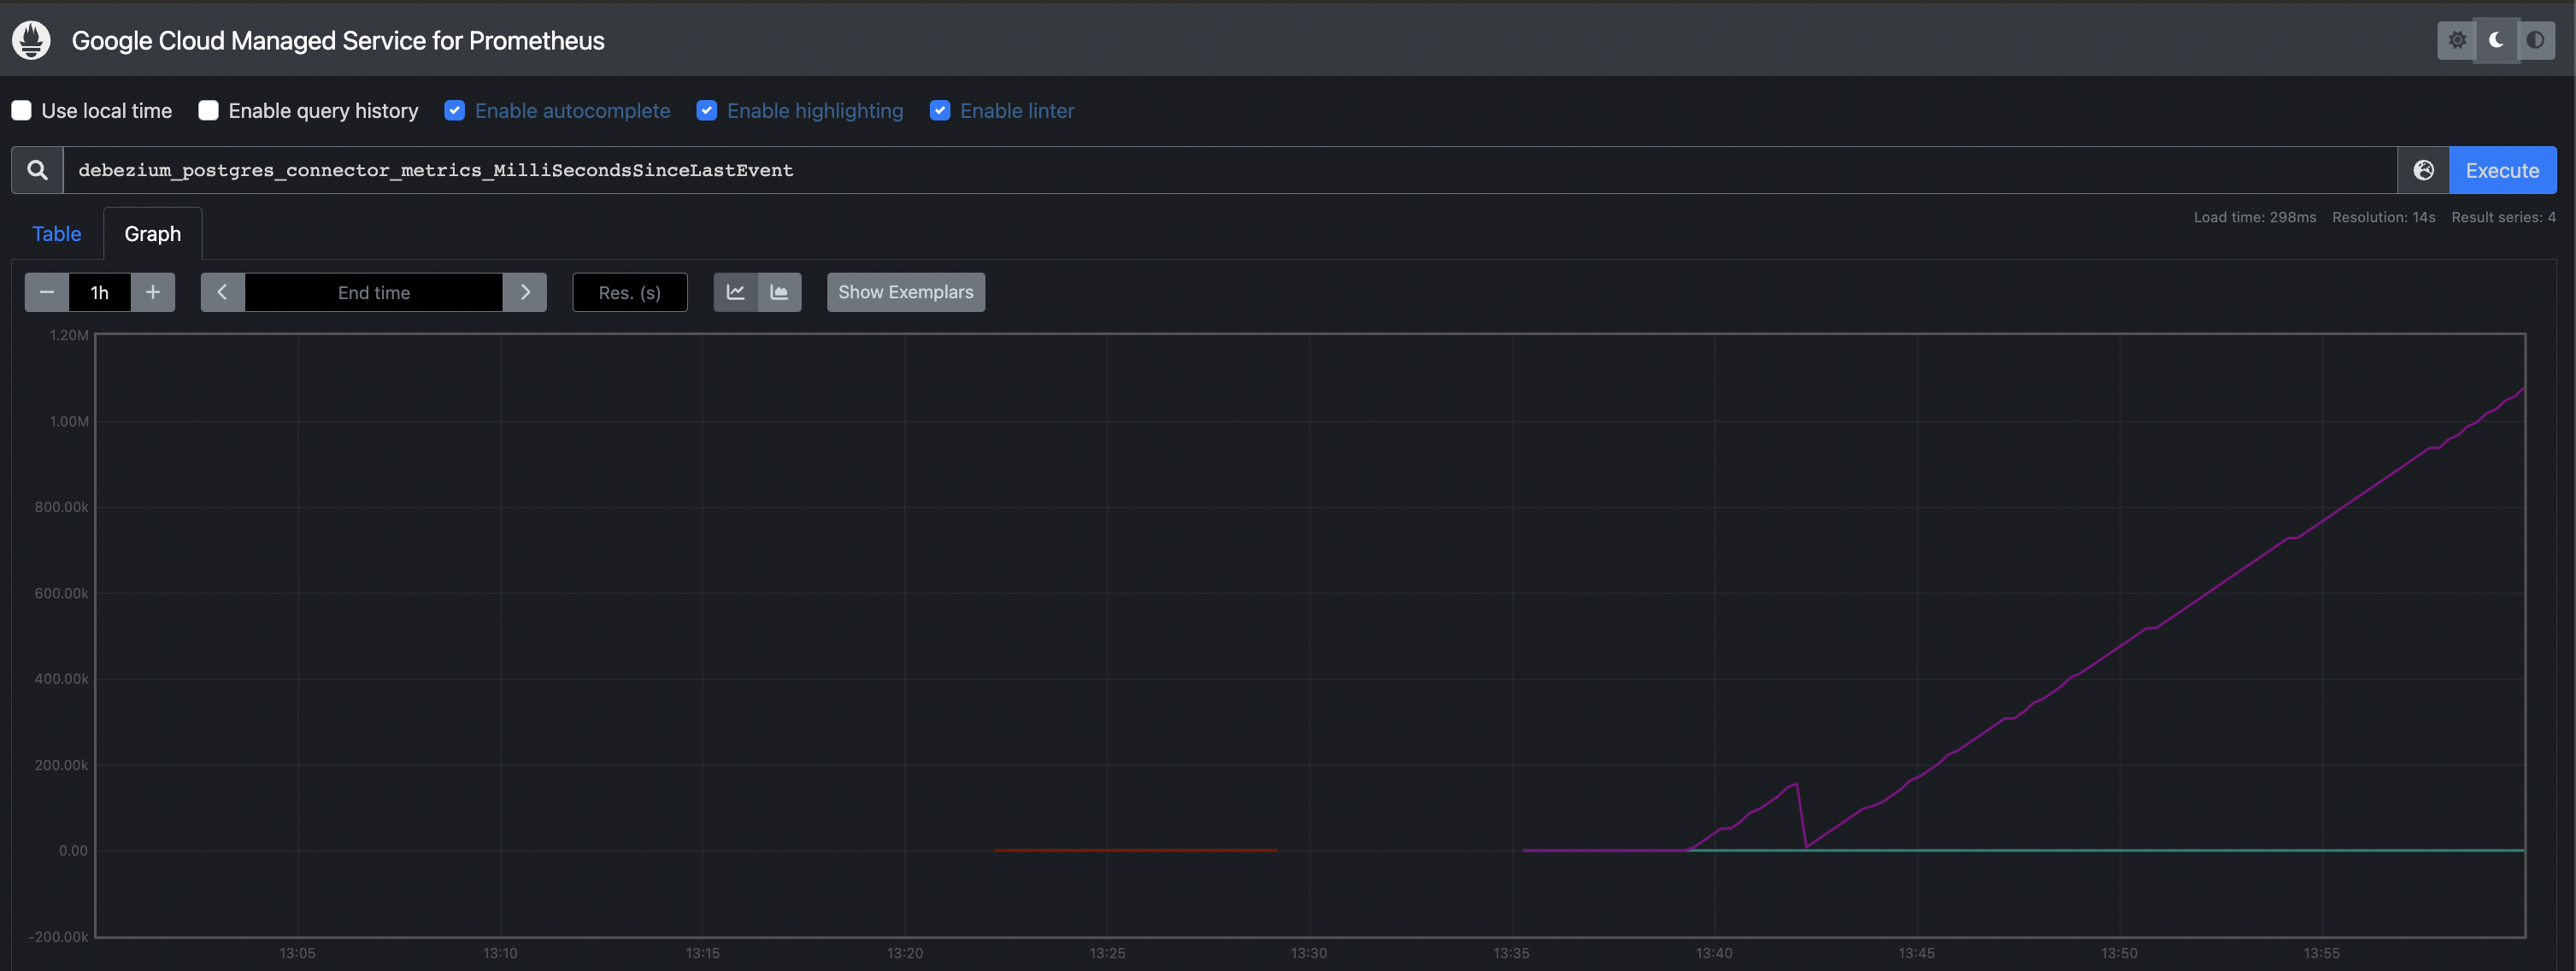
Hi @davidnateberg : literally just got today to look into it after I last pinged but basically, with ".*" option, I am able to see all the debezium metrics. I will continue to look into how i can replcae ".*" with something sensible. But for now, some progress :)
|
Beta Was this translation helpful? Give feedback.
-
|
Interesting, do you mean you set a rule to expose all the metrics. So your only rule is ".*"? Because I tried that as well with no luck. But I may have been misunderstanding how to view what metrics were exposed in Prometheus and it was actually there and I just missed it. |
Beta Was this translation helpful? Give feedback.
-
|
@ee07dazn I'm also curious if you're deploying a kafka cluster with your strimzi setup as well, because i am pointing my kafka connect cluster at a kafka cluster hosted elsewhere, in AWS, and I'm wondering if that has anything to do with it. |
Beta Was this translation helpful? Give feedback.
-
|
@davidnateberg : yup, just .* (see attached) I am not using strimzi kafka cluster but redpanda BYOC version deployed in GCP. |
Beta Was this translation helpful? Give feedback.
-
|
@davidnateberg - couple of things :
|
Beta Was this translation helpful? Give feedback.
-
|
|
Beta Was this translation helpful? Give feedback.
-
|
@ee07dazn and @davidnateberg I'm running a Debezium connector in a Strimzi Searching for them on the connect pods using this command: I'm also on the latest stable version of Debezium. @davidnateberg did you ever get the metrics to surface? |
Beta Was this translation helpful? Give feedback.
-
|
We're using Datadog and their implementation of Prometheus called openmetrics, which I'm under the impression should do the same thing as a Prometheus server which is scrape metrics from a given endpoint. I would think that if the metrics aren't showing up in the curl output on port 9404 then Prometheus/openmetrics would also not find them there. I'll try this configuration and let you know if it works. |
Beta Was this translation helpful? Give feedback.
-
|
It turns out in my case that I was looking at the wrong connect pod when trying to curl for the debezium metrics. The metrics will only surface on the pod hosting the worker hosting the connector, and since I only have one connector so far, the metrics were only on one pod/worker and it was not the pod/worker I was looking at. Anyone who finds this in the future, be sure you're looking at the pod/worker that is hosting your debezium connector, which you can see in the output of |
Beta Was this translation helpful? Give feedback.
-
|
You would definitely need to see them in the |
Beta Was this translation helpful? Give feedback.
-
Hehe, it came to my mind few seconds later :-D. |
Beta Was this translation helpful? Give feedback.
-
@jslusher ah that makes complete sense 🤦 And I wasn't saying our Prometheus deployment was the reason I could see metrics, just that I could in Prometheus so I stopped caring too much about why I couldn't see them at the pod level. But this makes complete sense, I'm sure I was just looking at the metrics on the wrong pod. It makes sense why the would be in Prometheus though because Prometheus was monitoring all the connect pods in the cluster. |
Beta Was this translation helpful? Give feedback.
-
|
Closing this discussion after @jslusher pointed out the metrics only being available on certain pods. I think that's the underlying issue here if anyone else comes along and reads this discussion https://github.com/orgs/strimzi/discussions/7914#discussioncomment-5676210 |
Beta Was this translation helpful? Give feedback.
Uh oh!
There was an error while loading. Please reload this page.
Uh oh!
There was an error while loading. Please reload this page.
-
Hello, I am currently deploying strimzi in a kubernetes cluster, with the following configuration.
strimzi version: 0.32.0
k8s cluster version: 1.23
helm version: 3.7.1
I have installed the operator with the default values, and everything behaves as expected, except that I am trying to expose metrics from a Debezium postgresql connector connect plugin that is running in the kafka connect cluster. https://debezium.io/documentation/reference/stable/connectors/postgresql.html.
Here is the Debezium documentation for exposing metrics. https://debezium.io/documentation/reference/stable/operations/monitoring.html. I have tried setting the various environment variables on the connect pods as mentioned in the documentation with no luck, though I'm not even sure if that is necessary. I thought these mBeans should be exposed on the connect cluster automatically.
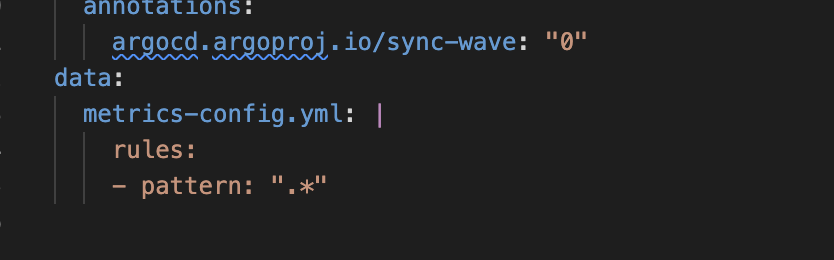
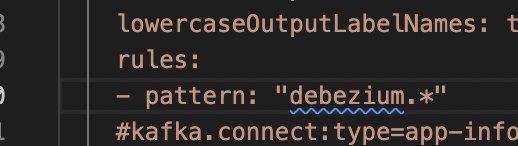
The metrics config I have is the default connect metrics config in the strimzi examples folder, with patters for the debezium plugin included. It looks like this
I am able to see all the kafka connect metrics in prometheus as expected, or if exec into a pod and curl
localhost:9094/metricsI can see them there as well. However, there are no Debzium metrics exposed. I copied the patterns for the Debezium plugin pattern from their documentation here https://github.com/debezium/debezium-examples/blob/main/monitoring/debezium-jmx-exporter/config.ymlThe kafka connect resource manifest looks like this, though I dont think its an issue with the cluster because everything else works as expected
Any help would be greatly appreciated. To reiterate, I am trying to get JMX metrics from a kafka connect plugin, in this case the Debeziuim postgres plugin, exposed on the kafka connect cluster using the Prometheus JMX exporter. Thank you.
Beta Was this translation helpful? Give feedback.
All reactions