Replies: 1 comment 13 replies
-
|
TBH, I'm not sure I follow what the actual issue is. Having Prometheus and Kafka in different namespaces works completely fine without any issues. |
Beta Was this translation helpful? Give feedback.
-
|
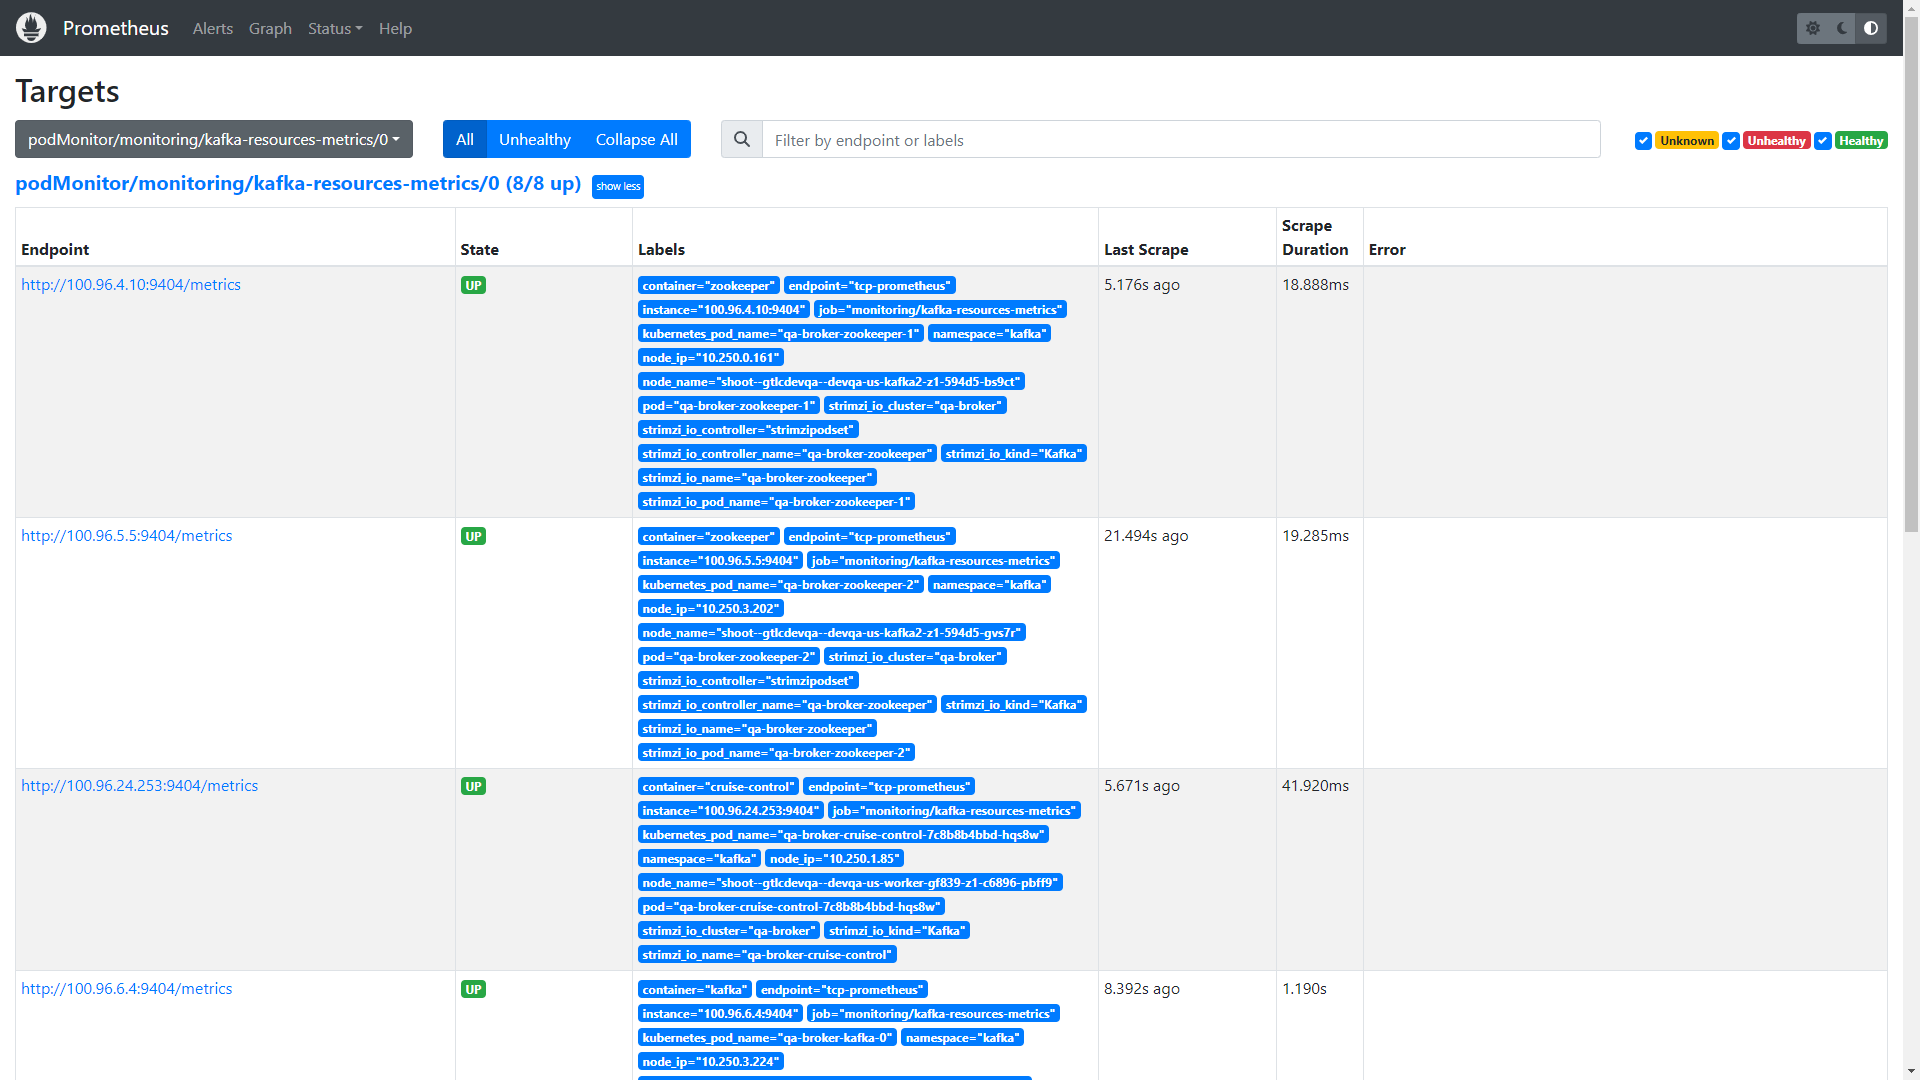
here is the targets info of prometheus, They are all UP status |
Beta Was this translation helpful? Give feedback.
-
# strimzi-0.32.0/examples/metrics/prometheus-install/strimzi-pod-monitor.yaml file
apiVersion: monitoring.coreos.com/v1
kind: PodMonitor
metadata:
  name: cluster-operator-metrics
  labels:
    app: strimzi
spec:
  selector:
    matchLabels:
      strimzi.io/kind: cluster-operator
  namespaceSelector:
    matchNames:
      - kafka
  podMetricsEndpoints:
  - path: /metrics
    port: http
---
apiVersion: monitoring.coreos.com/v1
kind: PodMonitor
metadata:
  name: entity-operator-metrics
  labels:
    app: strimzi
spec:
  selector:
    matchLabels:
      app.kubernetes.io/name: entity-operator
  namespaceSelector:
    matchNames:
      - kafka
  podMetricsEndpoints:
  - path: /metrics
    port: healthcheck
---
apiVersion: monitoring.coreos.com/v1
kind: PodMonitor
metadata:
  name: bridge-metrics
  labels:
    app: strimzi
spec:
  selector:
    matchLabels:
      strimzi.io/kind: KafkaBridge
  namespaceSelector:
    matchNames:
      - kafka
  podMetricsEndpoints:
  - path: /metrics
    port: rest-api
---
apiVersion: monitoring.coreos.com/v1
kind: PodMonitor
metadata:
  name: kafka-resources-metrics
  labels:
    app: strimzi
spec:
  selector:
    matchExpressions:
      - key: "strimzi.io/kind"
        operator: In
        values: ["Kafka", "KafkaConnect", "KafkaMirrorMaker", "KafkaMirrorMaker2"]
  namespaceSelector:
    matchNames:
      - kafka
  podMetricsEndpoints:
  - path: /metrics
    port: tcp-prometheus
    relabelings:
    - separator: ;
      regex: __meta_kubernetes_pod_label_(strimzi_io_.+)
      replacement: $1
      action: labelmap
    - sourceLabels: [__meta_kubernetes_namespace]
      separator: ;
      regex: (.*)
      targetLabel: namespace
      replacement: $1
      action: replace
    - sourceLabels: [__meta_kubernetes_pod_name]
      separator: ;
      regex: (.*)
      targetLabel: kubernetes_pod_name
      replacement: $1
      action: replace
    - sourceLabels: [__meta_kubernetes_pod_node_name]
      separator: ;
      regex: (.*)
      targetLabel: node_name
      replacement: $1
      action: replace
    - sourceLabels: [__meta_kubernetes_pod_host_ip]
      separator: ;
      regex: (.*)
      targetLabel: node_ip
      replacement: $1
      action: replace
# strimzi-0.32.0/examples/metrics/prometheus-install/prometheus-rules.yaml file
apiVersion: monitoring.coreos.com/v1
kind: PrometheusRule
metadata:
  labels:
    role: alert-rules
    app: strimzi
  name: prometheus-k8s-rules
spec:
  groups:
  - name: kafka
    rules:
    - alert: KafkaRunningOutOfSpace
      expr: kubelet_volume_stats_available_bytes{persistentvolumeclaim=~"data(-[0-9]+)?-(.+)-kafka-[0-9]+"} * 100 / kubelet_volume_stats_capacity_bytes{persistentvolumeclaim=~"data(-[0-9]+)?-(.+)-kafka-[0-9]+"} < 15
      for: 10s
      labels:
        severity: warning
      annotations:
        summary: 'Kafka is running out of free disk space'
        description: 'There are only {{ $value }} percent available at {{ $labels.persistentvolumeclaim }} PVC'
    - alert: UnderReplicatedPartitions
      expr: kafka_server_replicamanager_underreplicatedpartitions > 0
      for: 10s
      labels:
        severity: warning
      annotations:
        summary: 'Kafka under replicated partitions'
        description: 'There are {{ $value }} under replicated partitions on {{ $labels.kubernetes_pod_name }}'
    - alert: AbnormalControllerState
      expr: sum(kafka_controller_kafkacontroller_activecontrollercount) by (strimzi_io_name) != 1
      for: 10s
      labels:
        severity: warning
      annotations:
        summary: 'Kafka abnormal controller state'
        description: 'There are {{ $value }} active controllers in the cluster'
    - alert: OfflinePartitions
      expr: sum(kafka_controller_kafkacontroller_offlinepartitionscount) > 0
      for: 10s
      labels:
        severity: warning
      annotations:
        summary: 'Kafka offline partitions'
        description: 'One or more partitions have no leader'
    - alert: UnderMinIsrPartitionCount
      expr: kafka_server_replicamanager_underminisrpartitioncount > 0
      for: 10s
      labels:
        severity: warning
      annotations:
        summary: 'Kafka under min ISR partitions'
        description: 'There are {{ $value }} partitions under the min ISR on {{ $labels.kubernetes_pod_name }}'
    - alert: OfflineLogDirectoryCount
      expr: kafka_log_logmanager_offlinelogdirectorycount > 0
      for: 10s
      labels:
        severity: warning
      annotations:
        summary: 'Kafka offline log directories'
        description: 'There are {{ $value }} offline log directories on {{ $labels.kubernetes_pod_name }}'
    - alert: ScrapeProblem
      expr: up{kubernetes_namespace!~"openshift-.+",kubernetes_pod_name=~".+-kafka-[0-9]+"} == 0
      for: 3m
      labels:
        severity: major
      annotations:
        summary: 'Prometheus unable to scrape metrics from {{ $labels.kubernetes_pod_name }}/{{ $labels.instance }}'
        description: 'Prometheus was unable to scrape metrics from {{ $labels.kubernetes_pod_name }}/{{ $labels.instance }} for more than 3 minutes'
    - alert: ClusterOperatorContainerDown
      expr: count((container_last_seen{container="strimzi-cluster-operator"} > (time() - 90))) < 1 or absent(container_last_seen{container="strimzi-cluster-operator"})
      for: 1m
      labels:
        severity: major
      annotations:
        summary: 'Cluster Operator down'
        description: 'The Cluster Operator has been down for longer than 90 seconds'
    - alert: KafkaBrokerContainersDown
      expr: absent(container_last_seen{container="kafka",pod=~".+-kafka-[0-9]+"})
      for: 3m
      labels:
        severity: major
      annotations:
        summary: 'All `kafka` containers down or in CrashLookBackOff status'
        description: 'All `kafka` containers have been down or in CrashLookBackOff status for 3 minutes'
    - alert: KafkaContainerRestartedInTheLast5Minutes
      expr: count(count_over_time(container_last_seen{container="kafka"}[5m])) > 2 * count(container_last_seen{container="kafka",pod=~".+-kafka-[0-9]+"})
      for: 5m
      labels:
        severity: warning
      annotations:
        summary: 'One or more Kafka containers restarted too often'
        description: 'One or more Kafka containers were restarted too often within the last 5 minutes'
  - name: zookeeper
    rules:
    - alert: AvgRequestLatency
      expr: zookeeper_avgrequestlatency > 10
      for: 10s
      labels:
        severity: warning
      annotations:
        summary: 'Zookeeper average request latency'
        description: 'The average request latency is {{ $value }} on {{ $labels.kubernetes_pod_name }}'
    - alert: OutstandingRequests
      expr: zookeeper_outstandingrequests > 10
      for: 10s
      labels:
        severity: warning
      annotations:
        summary: 'Zookeeper outstanding requests'
        description: 'There are {{ $value }} outstanding requests on {{ $labels.kubernetes_pod_name }}'
    - alert: ZookeeperRunningOutOfSpace
      expr: kubelet_volume_stats_available_bytes{persistentvolumeclaim=~"data-(.+)-zookeeper-[0-9]+"} < 5368709120
      for: 10s
      labels:
        severity: warning
      annotations:
        summary: 'Zookeeper is running out of free disk space'
        description: 'There are only {{ $value }} bytes available at {{ $labels.persistentvolumeclaim }} PVC'
    - alert: ZookeeperContainerRestartedInTheLast5Minutes
      expr: count(count_over_time(container_last_seen{container="zookeeper"}[5m])) > 2 * count(container_last_seen{container="zookeeper",pod=~".+-zookeeper-[0-9]+"})
      for: 5m
      labels:
        severity: warning
      annotations:
        summary: 'One or more Zookeeper containers were restarted too often'
        description: 'One or more Zookeeper containers were restarted too often within the last 5 minutes. This alert can be ignored when the Zookeeper cluster is scaling up'
    - alert: ZookeeperContainersDown
      expr: absent(container_last_seen{container="zookeeper",pod=~".+-zookeeper-[0-9]+"})
      for: 3m
      labels:
        severity: major
      annotations:
        summary: 'All `zookeeper` containers in the Zookeeper pods down or in CrashLookBackOff status'
        description: 'All `zookeeper` containers in the Zookeeper pods have been down or in CrashLookBackOff status for 3 minutes'
  - name: entityOperator
    rules:
    - alert: TopicOperatorContainerDown
      expr: absent(container_last_seen{container="topic-operator",pod=~".+-entity-operator-.+"})
      for: 3m
      labels:
        severity: major
      annotations:
        summary: 'Container topic-operator in Entity Operator pod down or in CrashLookBackOff status'
        description: 'Container topic-operator in Entity Operator pod has been or in CrashLookBackOff status for 3 minutes'
    - alert: UserOperatorContainerDown
      expr: absent(container_last_seen{container="user-operator",pod=~".+-entity-operator-.+"})
      for: 3m
      labels:
        severity: major
      annotations:
        summary: 'Container user-operator in Entity Operator pod down or in CrashLookBackOff status'
        description: 'Container user-operator in Entity Operator pod have been down or in CrashLookBackOff status for 3 minutes'
    - alert: EntityOperatorTlsSidecarContainerDown
      expr: absent(container_last_seen{container="tls-sidecar",pod=~".+-entity-operator-.+"})
      for: 3m
      labels:
        severity: major
      annotations:
        summary: 'Container tls-sidecar Entity Operator pod down or in CrashLookBackOff status'
        description: 'Container tls-sidecar in Entity Operator pod have been down or in CrashLookBackOff status for 3 minutes'
  - name: connect
    rules:
    - alert: ConnectContainersDown
      expr: absent(container_last_seen{container=~".+-connect",pod=~".+-connect-.+"})
      for: 3m
      labels:
        severity: major
      annotations:
        summary: 'All Kafka Connect containers down or in CrashLookBackOff status'
        description: 'All Kafka Connect containers have been down or in CrashLookBackOff status for 3 minutes'
  - name: bridge
    rules:
    - alert: BridgeContainersDown
      expr: absent(container_last_seen{container=~".+-bridge",pod=~".+-bridge-.+"})
      for: 3m
      labels:
        severity: major
      annotations:
        summary: 'All Kafka Bridge containers down or in CrashLookBackOff status'
        description: 'All Kafka Bridge containers have been down or in CrashLookBackOff status for 3 minutes'
    - alert: AvgProducerLatency
      expr: strimzi_bridge_kafka_producer_request_latency_avg > 10
      for: 10s
      labels:
        severity: warning
      annotations:
        summary: 'Kafka Bridge average consumer fetch latency'
        description: 'The average fetch latency is {{ $value }} on {{ $labels.clientId }}'
    - alert: AvgConsumerFetchLatency
      expr: strimzi_bridge_kafka_consumer_fetch_latency_avg > 500
      for: 10s
      labels:
        severity: warning
      annotations:
        summary: 'Kafka Bridge consumer average fetch latency'
        description: 'The average consumer commit latency is {{ $value }} on {{ $labels.clientId }}'
    - alert: AvgConsumerCommitLatency
      expr: strimzi_bridge_kafka_consumer_commit_latency_avg > 200
      for: 10s
      labels:
        severity: warning
      annotations:
        summary: 'Kafka Bridge consumer average commit latency'
        description: 'The average consumer commit latency is {{ $value }} on {{ $labels.clientId }}'
    - alert: Http4xxErrorRate
      expr: strimzi_bridge_http_server_requestCount_total{code=~"^4..$", container=~"^.+-bridge", path !="/favicon.ico"} > 10
      for: 1m
      labels:
        severity: warning
      annotations:
        summary: 'Kafka Bridge returns code 4xx too often'
        description: 'Kafka Bridge returns code 4xx too much ({{ $value }}) for the path {{ $labels.path }}'
    - alert: Http5xxErrorRate
      expr: strimzi_bridge_http_server_requestCount_total{code=~"^5..$", container=~"^.+-bridge"} > 10
      for: 1m
      labels:
        severity: warning
      annotations:
        summary: 'Kafka Bridge returns code 5xx too often'
        description: 'Kafka Bridge returns code 5xx too much ({{ $value }}) for the path {{ $labels.path }}'
  - name: mirrorMaker
    rules:
    - alert: MirrorMakerContainerDown
      expr: absent(container_last_seen{container=~".+-mirror-maker",pod=~".+-mirror-maker-.+"})
      for: 3m
      labels:
        severity: major
      annotations:
        summary: 'All Kafka Mirror Maker containers down or in CrashLookBackOff status'
        description: 'All Kafka Mirror Maker containers have been down or in CrashLookBackOff status for 3 minutes'
  - name: kafkaExporter
    rules:
    - alert: UnderReplicatedPartition
      expr: kafka_topic_partition_under_replicated_partition > 0
      for: 10s
      labels:
        severity: warning
      annotations:
        summary: 'Topic has under-replicated partitions'
        description: 'Topic  {{ $labels.topic }} has {{ $value }} under-replicated partition {{ $labels.partition }}'
    - alert: TooLargeConsumerGroupLag
      expr: kafka_consumergroup_lag > 1000
      for: 10s
      labels:
        severity: warning
      annotations:
        summary: 'Consumer group lag is too big'
        description: 'Consumer group {{ $labels.consumergroup}} lag is too big ({{ $value }}) on topic {{ $labels.topic }}/partition {{ $labels.partition }}'
    - alert: NoMessageForTooLong
      expr: changes(kafka_topic_partition_current_offset{topic!="__consumer_offsets"}[10m]) == 0
      for: 10s
      labels:
        severity: warning
      annotations:
        summary: 'No message for 10 minutes'
        description: 'There is no messages in topic {{ $labels.topic}}/partition {{ $labels.partition }} for 10 minutes'
# strimzi-0.32.0/examples/metrics/prometheus-additional-properties/prometheus-additional.yaml file
apiVersion: v1
kind: Secret
metadata:
  name: additional-scrape-configs
type: Opaque
stringData:
  prometheus-additional.yaml: |
    - job_name: kubernetes-cadvisor
      honor_labels: true
      scrape_interval: 10s
      scrape_timeout: 10s
      metrics_path: /metrics/cadvisor
      scheme: https
      kubernetes_sd_configs:
      - role: node
        namespaces:
          names: []
      bearer_token_file: /var/run/secrets/kubernetes.io/serviceaccount/token
      tls_config:
        ca_file: /var/run/secrets/kubernetes.io/serviceaccount/ca.crt
        insecure_skip_verify: true
      relabel_configs:
      - separator: ;
        regex: __meta_kubernetes_node_label_(.+)
        replacement: $1
        action: labelmap
      - separator: ;
        regex: (.*)
        target_label: __address__
        replacement: kubernetes.default.svc:443
        action: replace
      - source_labels: [__meta_kubernetes_node_name]
        separator: ;
        regex: (.+)
        target_label: __metrics_path__
        replacement: /api/v1/nodes/${1}/proxy/metrics/cadvisor
        action: replace
      - source_labels: [__meta_kubernetes_node_name]
        separator: ;
        regex: (.*)
        target_label: node_name
        replacement: $1
        action: replace
      - source_labels: [__meta_kubernetes_node_address_InternalIP]
        separator: ;
        regex: (.*)
        target_label: node_ip
        replacement: $1
        action: replace
      metric_relabel_configs:
      - source_labels: [container, __name__]
        separator: ;
        regex: POD;container_(network).*
        target_label: container
        replacement: $1
        action: replace
      - source_labels: [container]
        separator: ;
        regex: POD
        replacement: $1
        action: drop
      - source_labels: [container]
        separator: ;
        regex: ^$
        replacement: $1
        action: drop
      - source_labels: [__name__]
        separator: ;
        regex: container_(network_tcp_usage_total|tasks_state|memory_failures_total|network_udp_usage_total)
        replacement: $1
        action: drop

    - job_name: kubernetes-nodes-kubelet
      scrape_interval: 10s
      scrape_timeout: 10s
      scheme: https
      kubernetes_sd_configs:
      - role: node
        namespaces:
          names: []
      bearer_token_file: /var/run/secrets/kubernetes.io/serviceaccount/token
      tls_config:
        ca_file: /var/run/secrets/kubernetes.io/serviceaccount/ca.crt
        insecure_skip_verify: true
      relabel_configs:
      - action: labelmap
        regex: __meta_kubernetes_node_label_(.+)
      - target_label: __address__
        replacement: kubernetes.default.svc:443
      - source_labels: [__meta_kubernetes_node_name]
        regex: (.+)
        target_label: __metrics_path__
        replacement: /api/v1/nodes/${1}/proxy/metrics
|
Beta Was this translation helpful? Give feedback.
-
|
Could it be a problem with the filter condition of the PrmeQL statement defined in the strimzi-kafka-exporter.json file? |
Beta Was this translation helpful? Give feedback.
-
|
I have no idea what you mean by that. But I think it works fine for everyone else - or at least it works for me and I'm not aware of anyone commenting about something being wrong. |
Beta Was this translation helpful? Give feedback.
-
Hello Bro, this issue has been resolved and our Strimzi-kafka cluster is now deployed to production. To solve this problem, it has nothing to do with the Strimzi configuration, we modified the parameter settings of the datasource in the kube-prometheus/manifests/grafana-dashboardDatasources.yaml file, and then it worked fine. # kube-prometheus/manifests/grafana-dashboardDatasources.yaml file
apiVersion: v1
kind: Secret
metadata:
labels:
app.kubernetes.io/component: grafana
app.kubernetes.io/name: grafana
app.kubernetes.io/part-of: kube-prometheus
app.kubernetes.io/version: 8.5.5
name: grafana-datasources
namespace: monitoring
stringData:
datasources.yaml: |-
{
"apiVersion": 1,
"datasources": [
{
"access": "proxy",
"name": "prometheus",
"orgId": 1,
"type": "prometheus",
"url": "http://prometheus-operated:9090",
"version": 1,
"jsonData": { "httpMethod": "POST" },
"isDefault": true
}
]
}
type: Opaque
|
Beta Was this translation helpful? Give feedback.
Uh oh!
There was an error while loading. Please reload this page.
Uh oh!
There was an error while loading. Please reload this page.
-
Bug Description
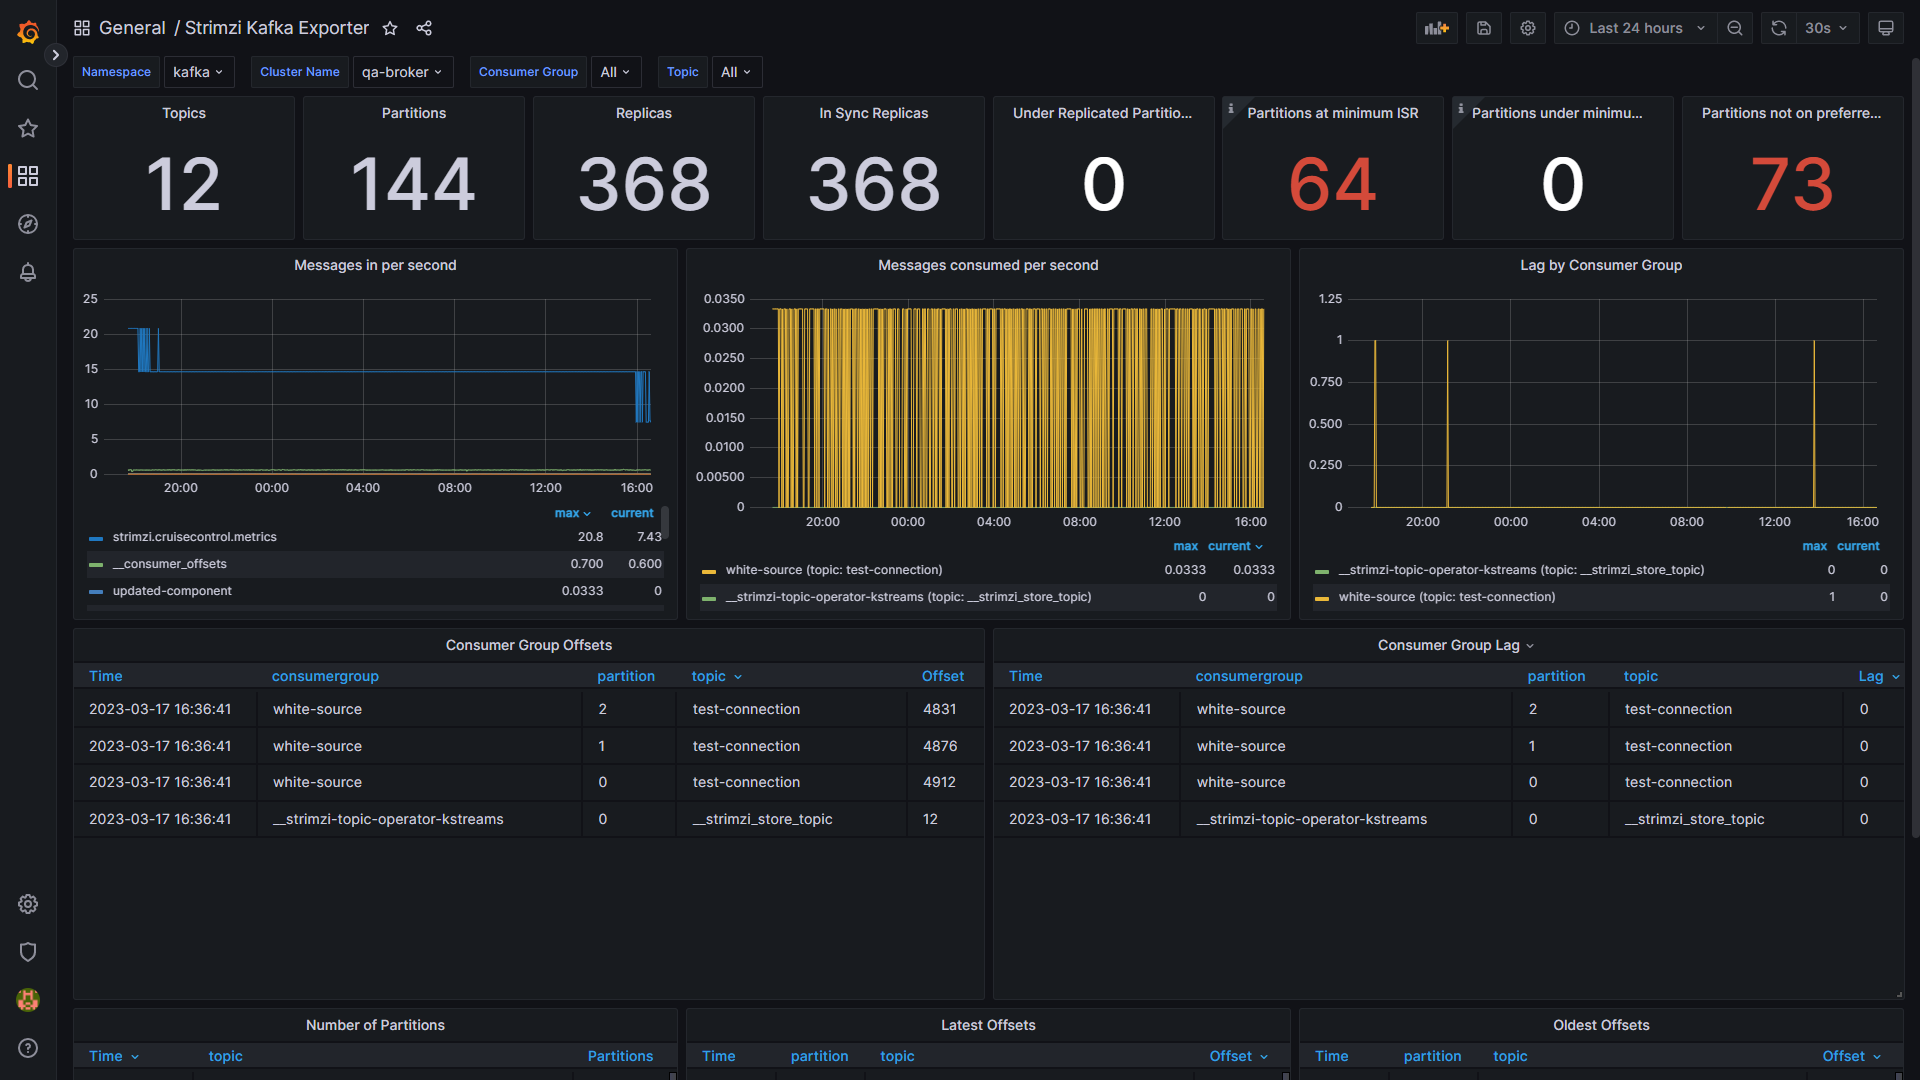
The kafka cluster is deployed in the kafka namespace, and Prometheus and grafana are deployed in the monitoring namespace (using kube-prometheus). Refer to the official documentation to configure everything to run well. The current problem is to import 5 grafana-dashboards (strimzi-cruise-control.json, strimzi-kafka-exporter.json, strimzi-kafka.json, strimzi-zookeeper.json and strimzi-operators.json) in grafana, except that the data display of strimzi-kafka-exporter.json is incorrect, other monitoring dashboards are very good good.
Is there any solution? Thank you very much!
Due to policy requirements, it must be deployed separately in two namespaces (deploying them all in the single kafka namespace dashboards works fine)
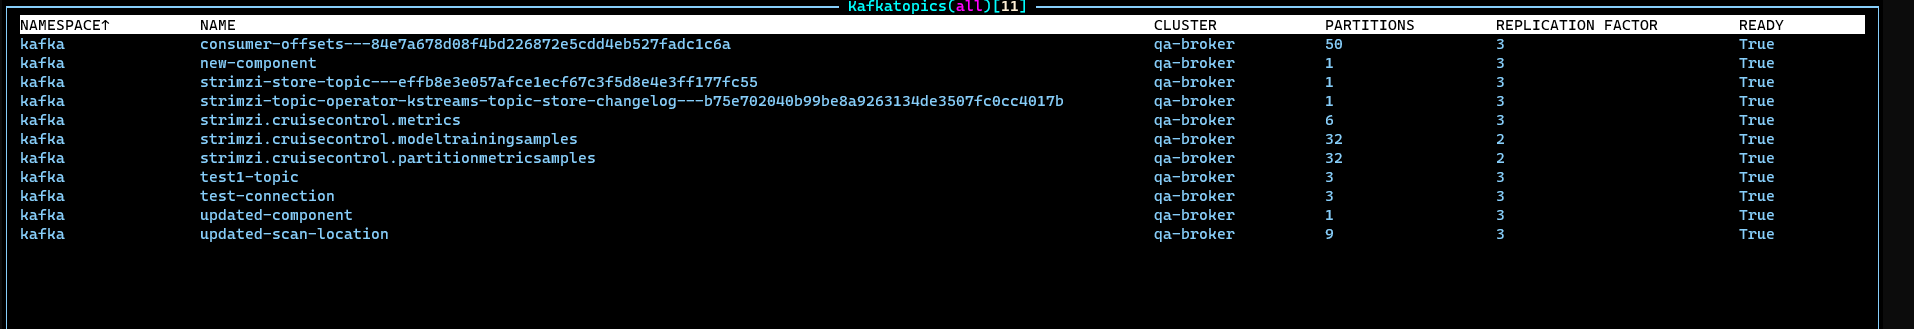
here is the kafka topics list
Steps to reproduce
git clone https://github.com/prometheus-operator/kube-prometheus.gitinstall kube-prometheus operatir's CRD
kubectl apply -f kube-prometheus/manifests/setup/sed -i 's/namespace: myproject/namespace: monitoring/g' strimzi-0.32.0/examples/metrics/prometheus-install/prometheus.yaml && sed -i 's/prometheus-server/prometheus-k8s/' strimzi-0.32.0/examples/metrics/prometheus-install/prometheus.yamlsed -i 's/myproject/kafka/g' strimzi-0.32.0/examples/metrics/prometheus-install/strimzi-pod-monitor.yamlwe merged strimzi-0.32.0\examples\metrics\prometheus-install\prometheus.yaml to kube-prometheus\manifests\prometheus-prometheus.yaml configuration and ClusterRole and ClusterRoleBinding
kubectl apply -f .\strimzi-0.32.0\examples\metrics\prometheus-additional-properties\ -n monitoring && kubectl apply -f .\strimzi-0.32.0\examples\metrics\prometheus-alertmanager-config\ -n monitoringExpected behavior
No response
Strimzi version
0.32.0
Kubernetes version
Kubernetes 1.23.13
Installation method
YAML files
Infrastructure
Kubernetes Native
Configuration files and logs
here is kafka cluster instance yaml file:
kube-prometheus merged yaml files:
Additional context
No response
Beta Was this translation helpful? Give feedback.
All reactions