Windows 2004 - Ryzen 7 2700X - BugCheck #5
Description
Hi, I am experiencing something similar to #2.
Context:
- I am manually mapping a kernel driver based on SimpleSvmHook (nearly no modification except adding stuff in entry point).
- I use a physical machine
- If I run the driver on a VMware vm, no bugcheck is occuring
- QUITE STRANGE: If I build the driver with NO optimizations, it work 3/5 times (I can get in windows and monitor QuerySys calls, and a similar bugcheck occur randomly after some time).
Below is the Windbg summary of the memory dump you can download by clicking this link
Microsoft (R) Windows Debugger Version 10.0.19528.1000 AMD64
Copyright (c) Microsoft Corporation. All rights reserved.
Loading Dump File [C:\WINDOWS\MEMORY.DMP]
Kernel Bitmap Dump File: Kernel address space is available, User address space may not be available.
************* Path validation summary **************
Response Time (ms) Location
Deferred srv*
Deferred SRV*\C:\Symbols*http://msdl.microsoft.com/download/symbols
Symbol search path is: srv*;SRV*\C:\Symbols*http://msdl.microsoft.com/download/symbols
Executable search path is:
Windows 10 Kernel Version 19041 MP (16 procs) Free x64
Product: WinNt, suite: TerminalServer SingleUserTS Personal
19041.1.amd64fre.vb_release.191206-1406
Machine Name:
Kernel base = 0xfffff806`62800000 PsLoadedModuleList = 0xfffff806`6342a310
Debug session time: Fri Sep 4 18:39:47.481 2020 (UTC + 2:00)
System Uptime: 0 days 0:00:11.128
Loading Kernel Symbols
...............................................................
................................................................
................................................................
...........
Loading User Symbols
PEB is paged out (Peb.Ldr = 00000000`00227018). Type ".hh dbgerr001" for details
Loading unloaded module list
.........
For analysis of this file, run !analyze -v
nt!KeBugCheckEx:
fffff806`62bddb60 48894c2408 mov qword ptr [rsp+8],rcx ss:0018:ffffd787`7a0dad30=0000000000000139
3: kd> !analyze -v
*******************************************************************************
* *
* Bugcheck Analysis *
* *
*******************************************************************************
KERNEL_SECURITY_CHECK_FAILURE (139)
A kernel component has corrupted a critical data structure. The corruption
could potentially allow a malicious user to gain control of this machine.
Arguments:
Arg1: 0000000000000004, The thread's stack pointer was outside the legal stack
extents for the thread.
Arg2: ffffd7877a0db050, Address of the trap frame for the exception that caused the bugcheck
Arg3: ffffd7877a0dafa8, Address of the exception record for the exception that caused the bugcheck
Arg4: 0000000000000000, Reserved
Debugging Details:
------------------
KEY_VALUES_STRING: 1
Key : Analysis.CPU.Sec
Value: 2
Key : Analysis.DebugAnalysisProvider.CPP
Value: Create: 8007007e on DESKTOP-JQK4JE6
Key : Analysis.DebugData
Value: CreateObject
Key : Analysis.DebugModel
Value: CreateObject
Key : Analysis.Elapsed.Sec
Value: 2
Key : Analysis.Memory.CommitPeak.Mb
Value: 61
Key : Analysis.System
Value: CreateObject
ADDITIONAL_XML: 1
BUGCHECK_CODE: 139
BUGCHECK_P1: 4
BUGCHECK_P2: ffffd7877a0db050
BUGCHECK_P3: ffffd7877a0dafa8
BUGCHECK_P4: 0
TRAP_FRAME: ffffd7877a0db050 -- (.trap 0xffffd7877a0db050)
NOTE: The trap frame does not contain all registers.
Some register values may be zeroed or incorrect.
rax=0000000000000000 rbx=0000000000000000 rcx=0000000000000000
rdx=0000000000000000 rsi=0000000000000000 rdi=0000000000000000
rip=0000000000000000 rsp=0000000000000000 rbp=0000000000000000
r8=0000000000000000 r9=0000000000000000 r10=0000000000000000
r11=0000000000000000 r12=0000000000000000 r13=0000000000000000
r14=0000000000000000 r15=0000000000000000
iopl=0 nv up di pl nz na pe nc
00000000`00000000 ?? ???
Resetting default scope
EXCEPTION_RECORD: ffffd7877a0dafa8 -- (.exr 0xffffd7877a0dafa8)
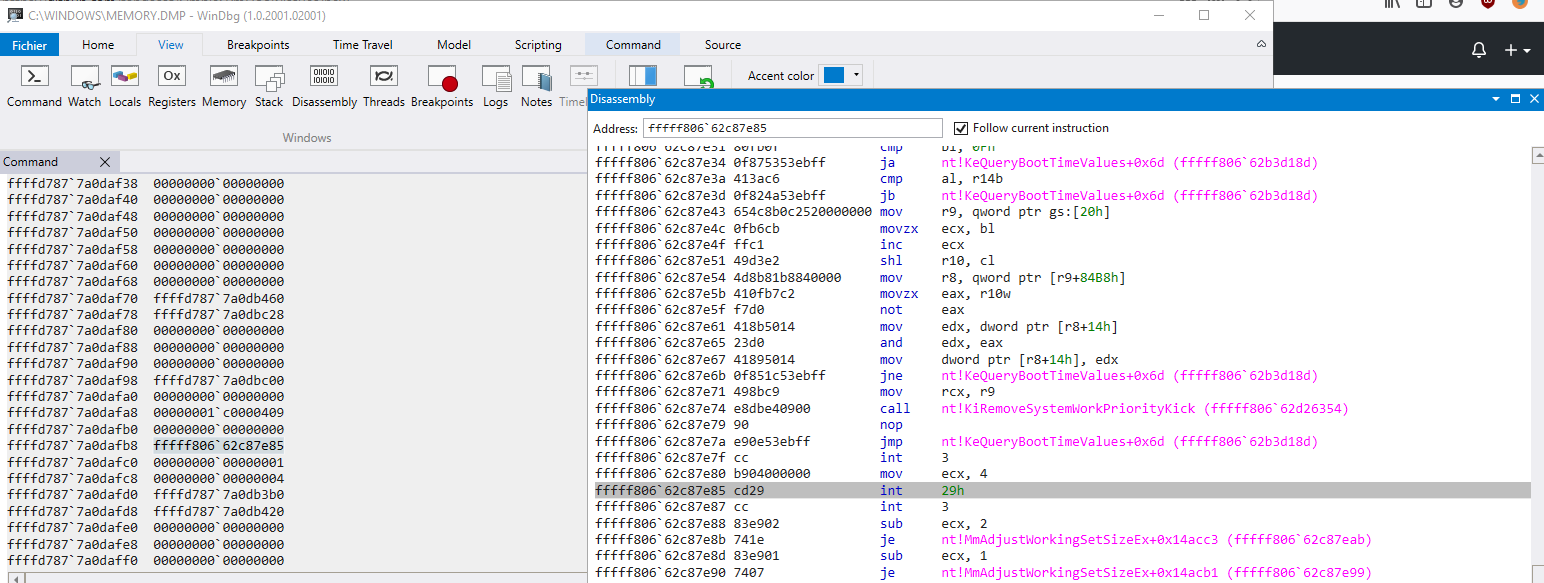
ExceptionAddress: fffff80662c87e85 (nt!RtlpGetStackLimitsEx+0x000000000014acc5)
ExceptionCode: c0000409 (Security check failure or stack buffer overrun)
ExceptionFlags: 00000001
NumberParameters: 1
Parameter[0]: 0000000000000004
Subcode: 0x4 FAST_FAIL_INCORRECT_STACK
BLACKBOXBSD: 1 (!blackboxbsd)
BLACKBOXNTFS: 1 (!blackboxntfs)
BLACKBOXWINLOGON: 1
PROCESS_NAME: svchost.exe
WATSON_BKT_EVENT: BEX
ERROR_CODE: (NTSTATUS) 0xc0000409 - Le syst me a d tect la saturation de la m moire tampon dans cette application. Cette saturation pourrait permettre un utilisateur mal intentionn de prendre le contr le de cette application.
EXCEPTION_CODE_STR: c0000409
EXCEPTION_PARAMETER1: 0000000000000004
EXCEPTION_STR: 0xc0000409
BAD_STACK_POINTER: ffffd7877a0dad28
STACK_TEXT:
ffffd787`7a0dad28 fffff806`62befa29 : 00000000`00000139 00000000`00000004 ffffd787`7a0db050 ffffd787`7a0dafa8 : nt!KeBugCheckEx
ffffd787`7a0dad30 fffff806`62befe50 : 00000000`00000000 00000000`00000000 00000000`00000000 00000000`00000000 : nt!KiBugCheckDispatch+0x69
ffffd787`7a0dae70 00000000`00000000 : 00000000`00000000 00000000`00000000 00000000`00000000 00000000`00000000 : nt!KiFastFailDispatch+0xd0
SYMBOL_NAME: nt!KiFastFailDispatch+d0
MODULE_NAME: nt
IMAGE_NAME: ntkrnlmp.exe
STACK_COMMAND: .thread ; .cxr ; kb
BUCKET_ID_FUNC_OFFSET: d0
FAILURE_BUCKET_ID: 0x139_MISSING_GSFRAME_STACKPTR_ERROR_nt!KiFastFailDispatch
OS_VERSION: 10.0.19041.1
BUILDLAB_STR: vb_release
OSPLATFORM_TYPE: x64
OSNAME: Windows 10
FAILURE_ID_HASH: {7b0febb5-6007-4f2b-3d38-57fef278d8d5}
Followup: MachineOwner
---------
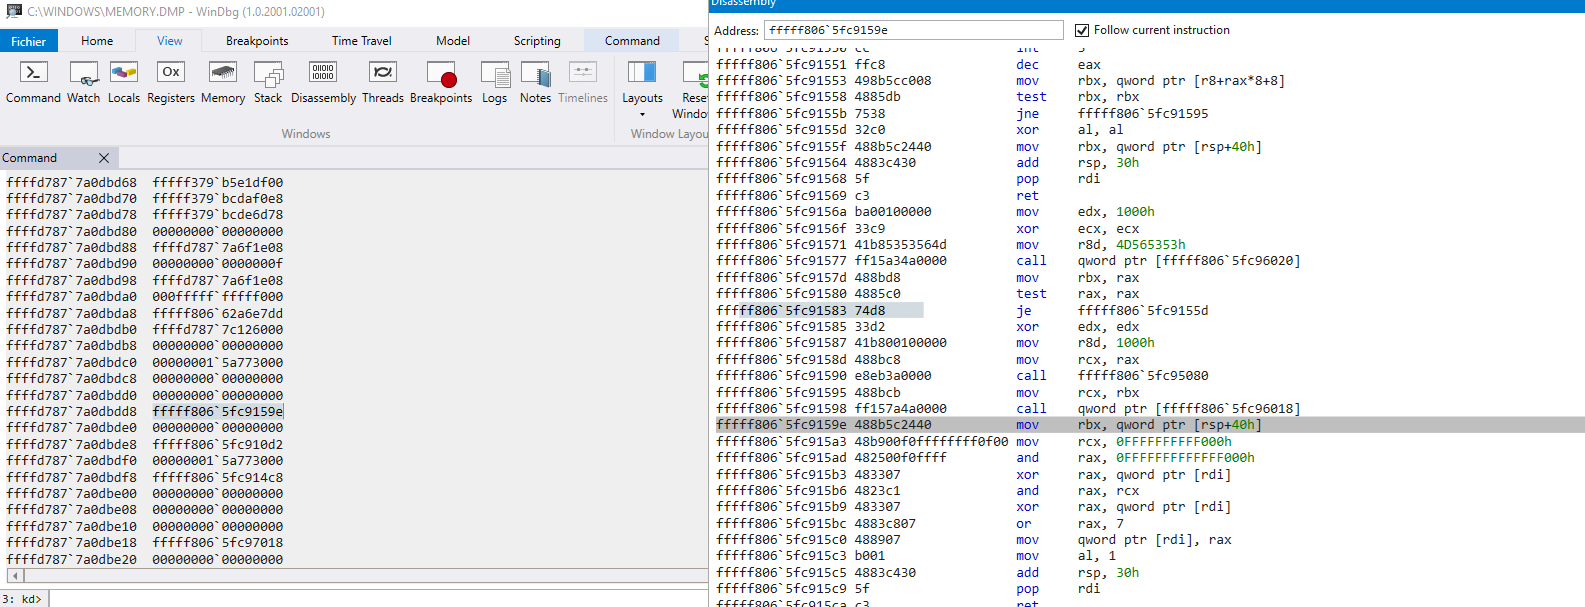
In my case, the memory dump doesn't give the full stack trace. But I managed to have some insight:
-
following the stack here is what I extracted
-
nt!RtlpGetStackLimitsEx
-
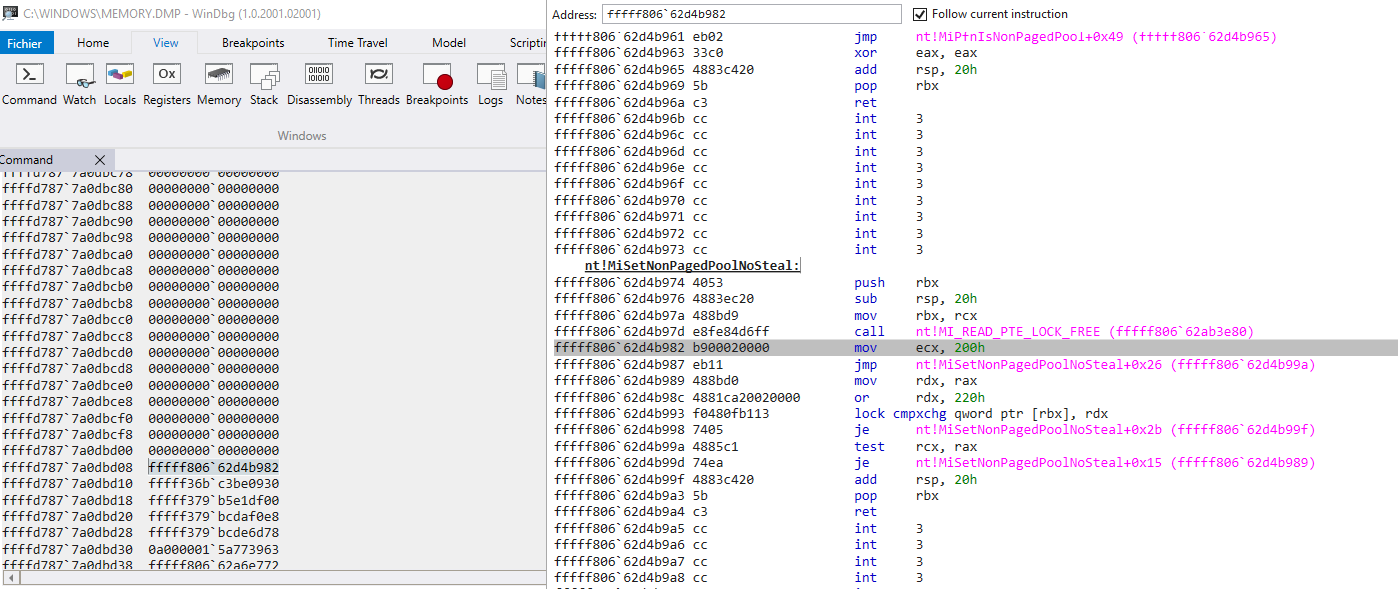
nt!nt!MiSetNonPagedPoolNoSteal
-
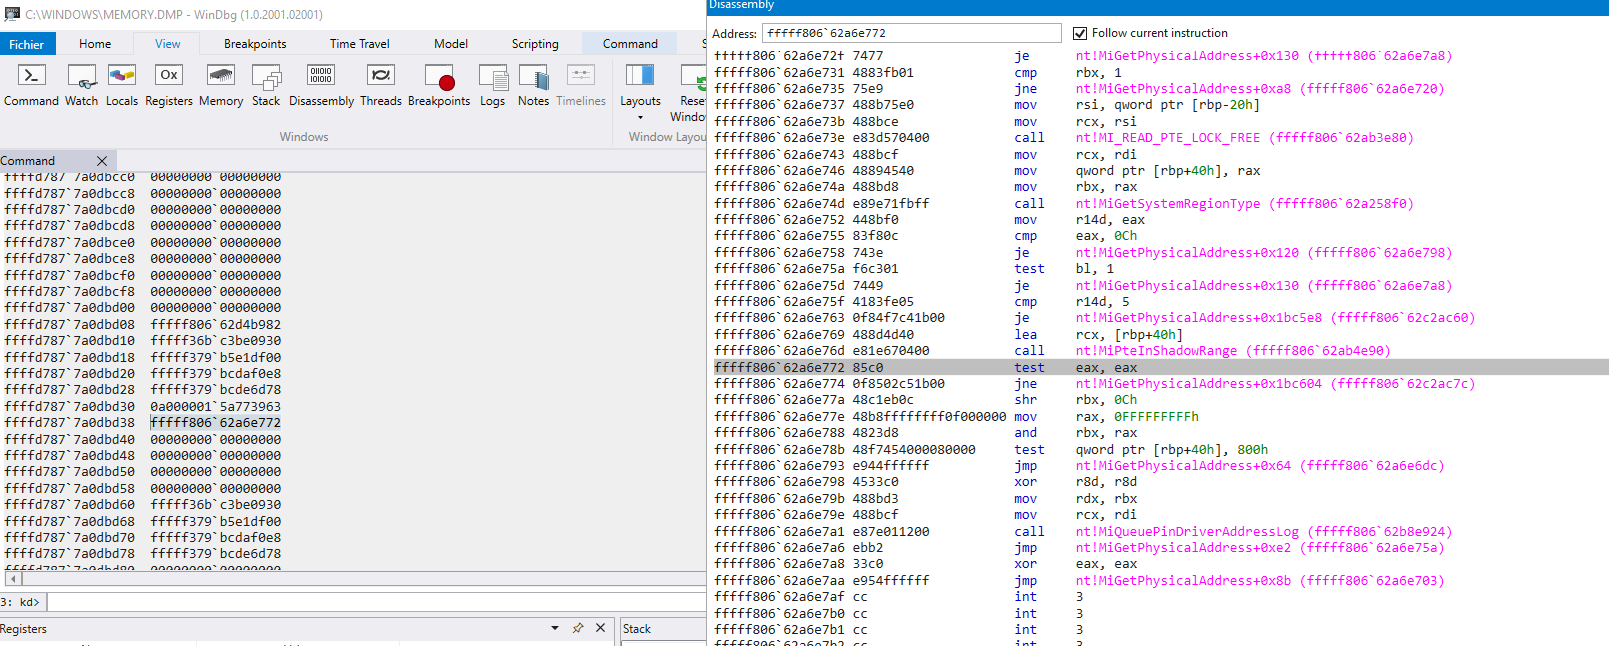
??????????? wtf is MiQueuePinDriverAddressLong also? patchguard???
-
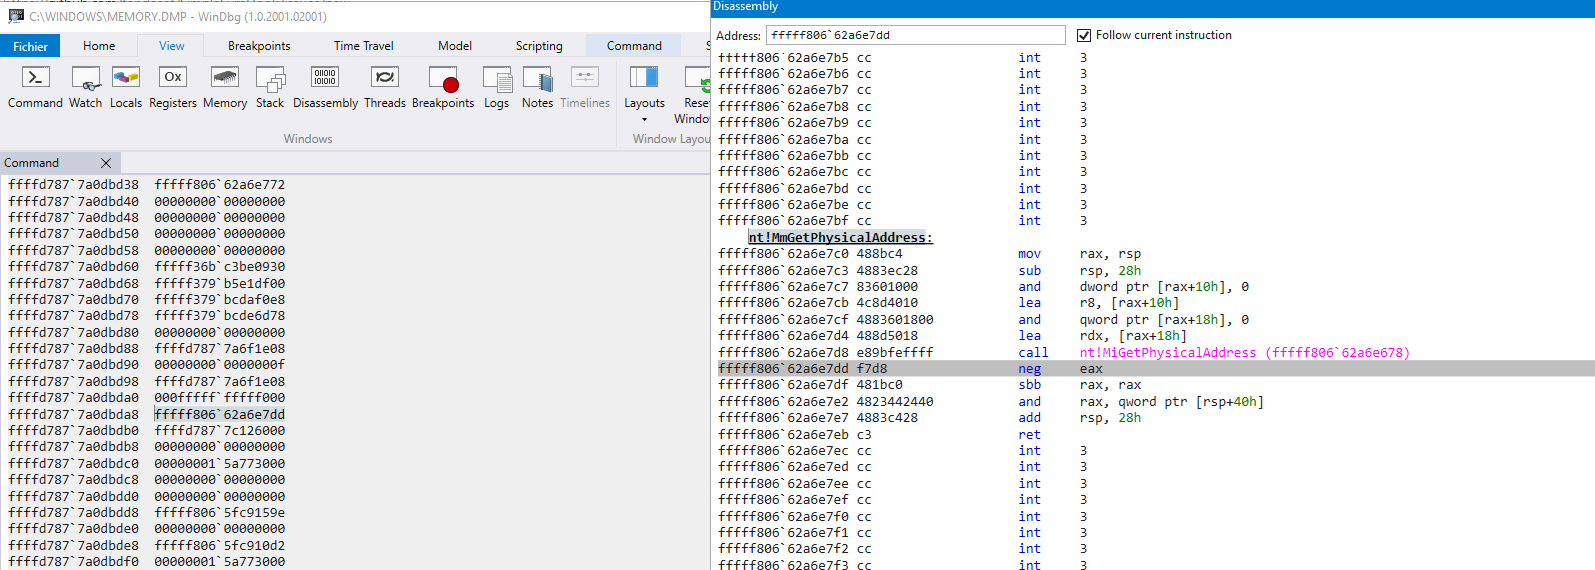
nt!MmGetPhysicalAddress
-
SimpleSvmHook!BuildNestedPageTableEntry
I really have no idea of what's going on and why this is happening from time to time.