Replies: 17 comments
-
|
During what periods? 24/7? If so, it would never sleep (I believe). When it falls into a deep sleep, do not believe those values are reported by the API. If you want it during drivers or charges, that is available. |
Beta Was this translation helpful? Give feedback.
-
|
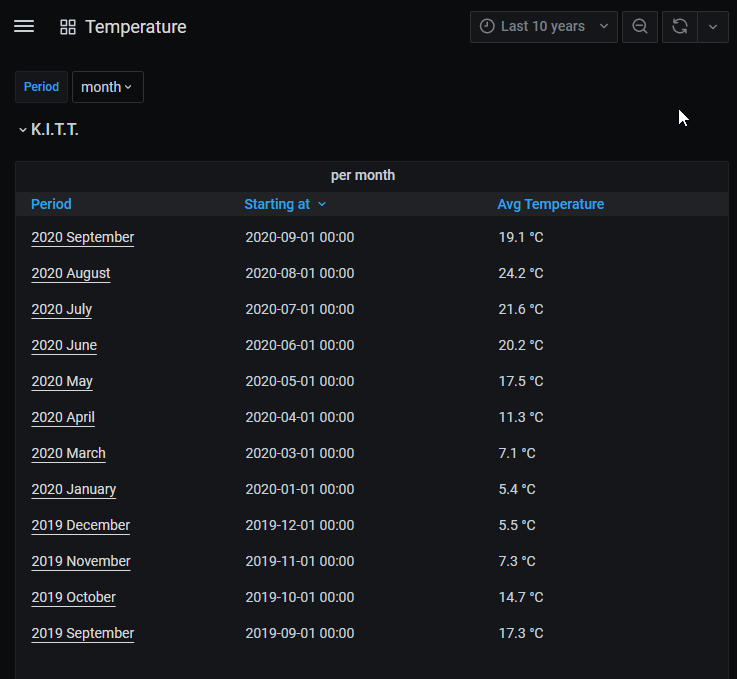
It is indeed. I've put together a temperature panel:
Import this (after unzipping of course :-): |
Beta Was this translation helpful? Give feedback.
-
|
Thoughts on adding this as part of the default install @adriankumpf ? |
Beta Was this translation helpful? Give feedback.
-
|
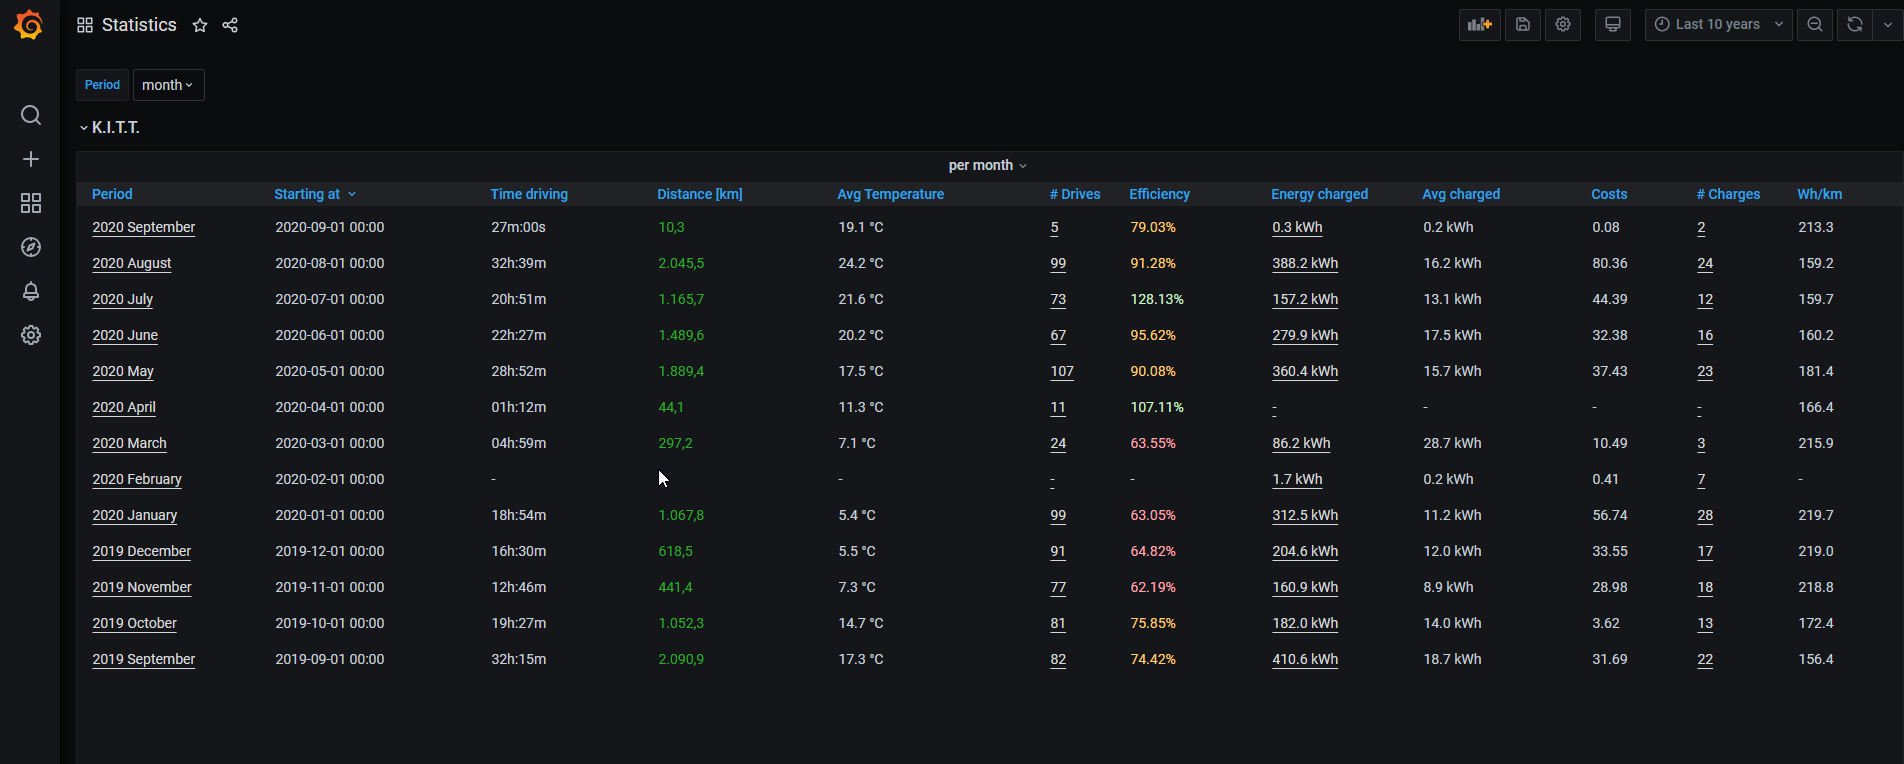
Well, it is a stripped down version of my statistics panel:
That still has the issue, that you have to change the postgresql server tiimezone to your timezone... See #664 (and would have to be migrated to the new table in Grafana 7, waiting for the bug fixes). Happy to share anyway. |
Beta Was this translation helpful? Give feedback.
-
I am not opposed to adding it, but I do not understand its purpose. Since the car sleeps most of the time and is therefore not available through the API, the dashboard only shows the average temperature during trips. What do you do with this information? The statistics panel looks pretty cool though. A PR would be appreciated @DrMichael but I don't know how to work around the timezone issue. |
Beta Was this translation helpful? Give feedback.
-
This is definitely really interesting statistics. Hopefully there is a way to set the timezone either through the interface or natively based upon the host. |
Beta Was this translation helpful? Give feedback.
-
Well, to make things worse, you can set the display timezone in Grafana 7 to every timezone instead of just UTC and local timezone... |
Beta Was this translation helpful? Give feedback.
-
I would hold back, until it is running properly with Grafana 7... Still two bugs with hidden fields and formatting timestamps. And still have to figure out, how to handel the km/mi and c/f settings reasonably, @adriankumpf any idea there? |
Beta Was this translation helpful? Give feedback.
-
|
Yes, it's a real pity that the new component still doesn't support hidden fields. Can the timestamp problem solved with a custom format (grafana/grafana#24917)? What's the issue with units again? The existing conversion helpers do not work? |
Beta Was this translation helpful? Give feedback.
-
Well, it turns out, that formatting a time string does not work. It does work though for timestamps with "time: YYY-MM-DD HH:mm" e.g.
Ah, you can deal with that by using regexes... But, it appears to me, that the "new" fields (e.g. when you switch km to mi) show up at the far right of the table. What are the conversion helpers? |
Beta Was this translation helpful? Give feedback.
-
Ah ok, I thought you meant the conversion from km to mi based on user settings. |
Beta Was this translation helpful? Give feedback.
-
|
Oh, yes, I use e.g. "convert_km(sum(distance)::numeric, '$length_unit')" in queries... (just to make others aware of that... :-) |
Beta Was this translation helpful? Give feedback.
-
|
What id like to see is similar to this chart in Stats app: Essentially it’s a temperature/efficiency chart. |
Beta Was this translation helpful? Give feedback.
-
|
This sounds very useful - if only when the car is awake. Efficiency chart is cool but also as a simple plot over time (like the charge in the battery); to illustrate how warm/cold it was when the car was used. A bit more esoteric would be a temperature per location over a trip - that would be a stretch for simple usage but I would find it interesting to see the temperature gradient while driving down to the city for example. |
Beta Was this translation helpful? Give feedback.
-
|
A bit late to the party, but I think discarding a temperature logging dashboard due to the car sleeping would be a mistake. Sentry mode keeps the car online all the time, and large amounts of data can be collected this way. Those whose car sleeps often can just not use this dashboard much, and temperature while driving only would still be interesting. Speaking of, would there be a way to add a hour period to @DrMichael's dashboard? The car would be a great way for me to get geolocalized hourly data. |
Beta Was this translation helpful? Give feedback.
-
|
With the shameful assistance of AI, I could get something that starts looking interesting:
We can clearly see the drive when inside temperature increased, while the rest was at parking (with sentry mode on, so no sleep). I'm not posting the json because it is not fully functional yet, especially the map which is pretty barebones, but the dashboard allows showing raw samples or aggregating to buckets and seems to work fine at that. What would be nice would be to track on the map as the cursor moves in the top plot or table, and use the map to restrict the sample area to plot. That's an expensive thermometer, but could be useful in some scenarios. |


Beta Was this translation helpful? Give feedback.
-
|
Here is an attempt ready to test: All samples: 6-hour averages: Temperature logs-1767144817914.json I hope it's not too broken, but don't expect much, it's AI-generated and not proof-read. Edits:
|


Beta Was this translation helpful? Give feedback.
Uh oh!
There was an error while loading. Please reload this page.
-
What would you like to be added:
Add a new dashboard which shows a chronological chart of the outside temperature. Nice to have: also display the inside temperature.
Why is this needed:
The car collects the information (inside temperature, outside temperature) - This is informative
Additional context:
Beta Was this translation helpful? Give feedback.
All reactions