Incorrect guide type and keys when type paremeter to scale_fill_binned() is a function #4234
Description
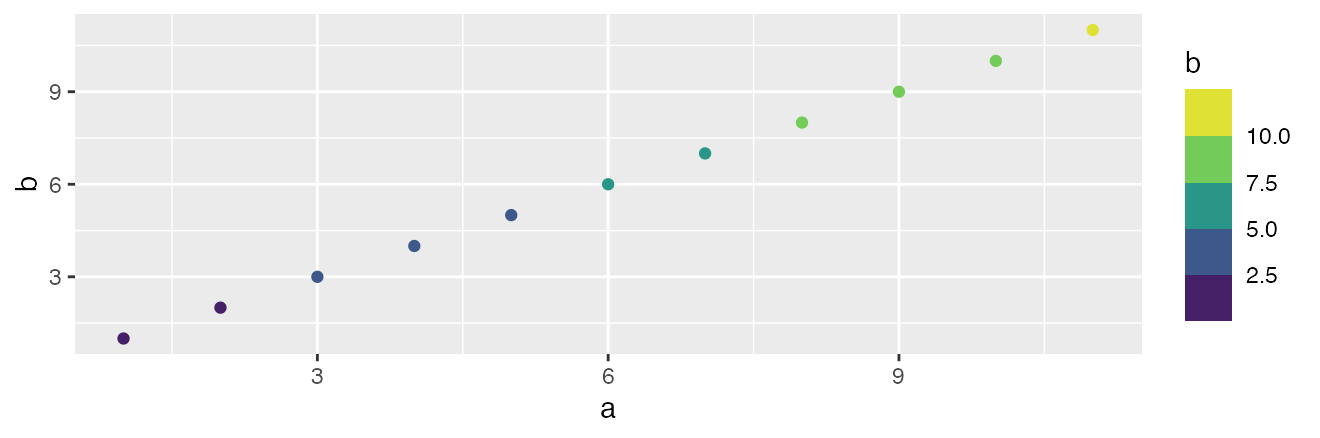
When a function is passed to the type argument of scale_colour_binned(), the plot has the colourscale guide, not the bins guide it presumably should have.
Second and more importantly, when the binned guide is forced, its colour values differ from those in the geom - a colour at one end of the scale is missing. This only occurs for some lengths of/values in the data, presumably because of the binning transformation, but I was not able to diagnose when exactly it occurs beyond the two contrasting examples below.
This does not occur when "viridis" is passed to the type parameter instead of scale_colour_viridis_c. My expectation was that these are equivalents and should behave identically.
Reprex below using geom_point() and the colour aesthetic; I've also reproduced the issue with geom_sf() and the fill aesthetic.
Reproduced using current github master branches of {ggplot2} and {scales}.
library(ggplot2)
library(dplyr)
df <- data.frame(a = 1:100, b = 1:100)

ggplot(df[1:11,]) +
  geom_point(aes(colour = b, x = a, y = b)) +
  scale_colour_binned(type = scale_colour_viridis_c)
First problem: an incorrect guide type is produced - colour bar instead of colour bins.
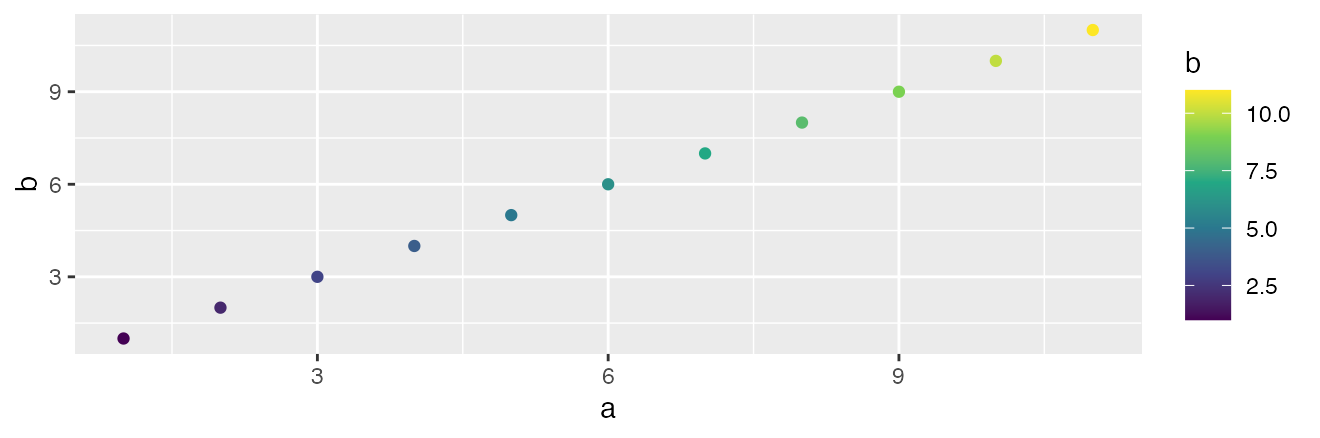
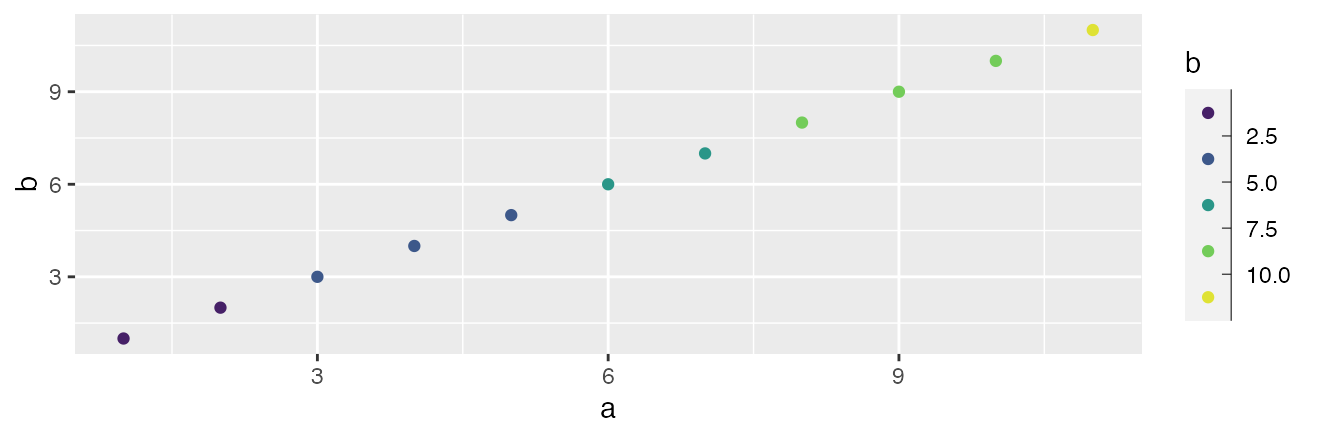
When I force colour bins, the bottom bin colour (bright yellow) is missing from the guide:
ggplot(df[1:11,]) +
  geom_point(aes(colour = b, x = a, y = b)) +
  scale_colour_binned(type = scale_colour_viridis_c, guide = "bins")

(This also occurs when type = scale_fill_distiller and when guide = "coloursteps".)
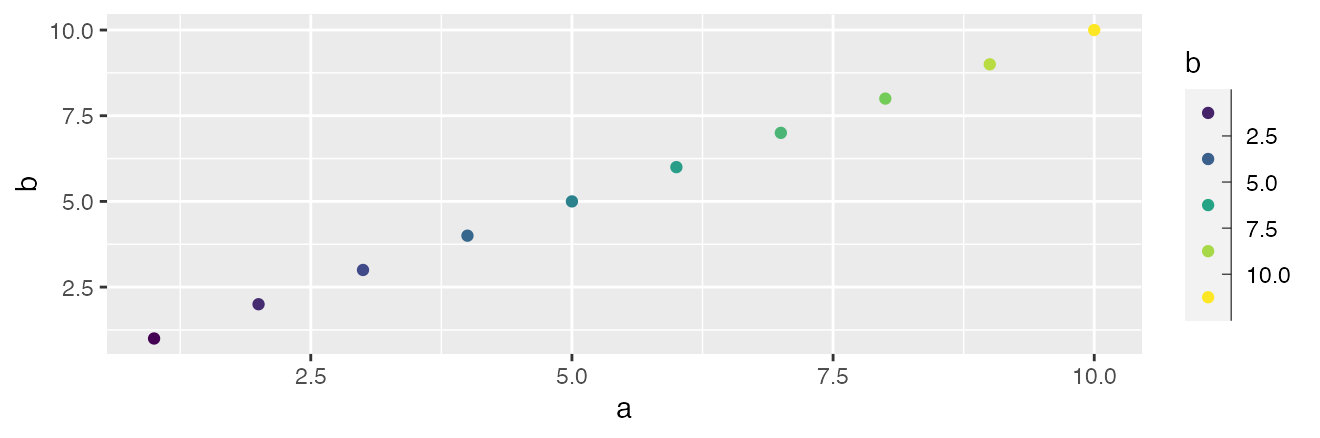
However this only occurs with some data - if I only take the first 10 rows, the guide is correct (but still has to be forced):
ggplot(df[1:10,]) +
  geom_point(aes(colour = b, x = a, y = b)) +
  scale_colour_binned(type = scale_colour_viridis_c, guide = "bins")
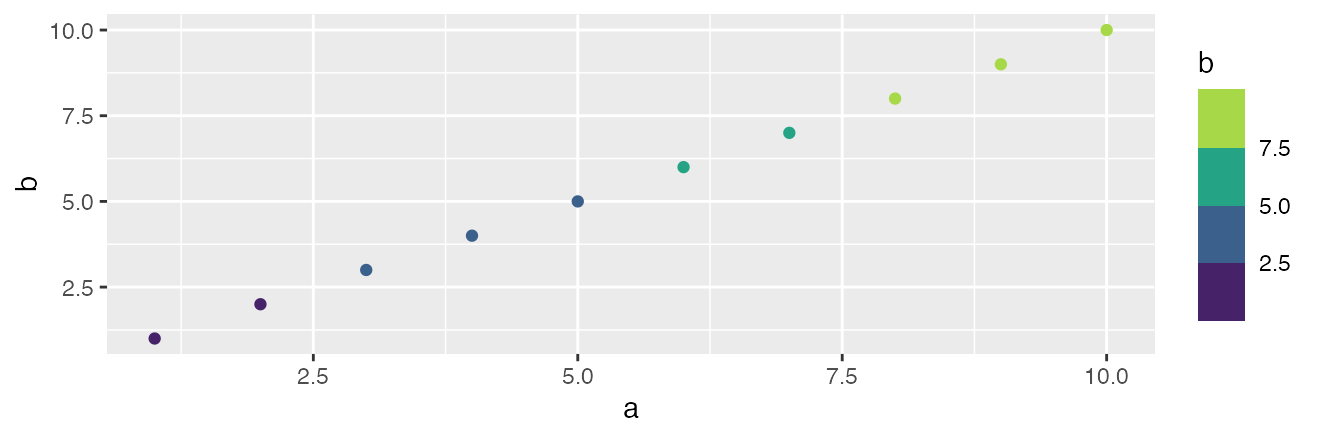
The colour values issue does not occur with either input data when type = "viridis":
ggplot(df[1:10,]) +
  geom_point(aes(colour = b, x = a, y = b)) +
  scale_colour_binned(type = "viridis")
ggplot(df[1:11,]) +
  geom_point(aes(colour = b, x = a, y = b)) +
  scale_colour_binned(type = "viridis")
Though the guide type (shape?) is still perhaps unexpected? This seems to be a coloursteps fill guide, not a colour bins guide. Also its direction is reversed, on which see #4210.
In any case, if I again force the bins guide, its colour range is correct:
ggplot(df[1:11,]) +
  geom_point(aes(colour = b, x = a, y = b)) +
  scale_colour_binned(type = "viridis", guide = "bins")