library(tidyverse)

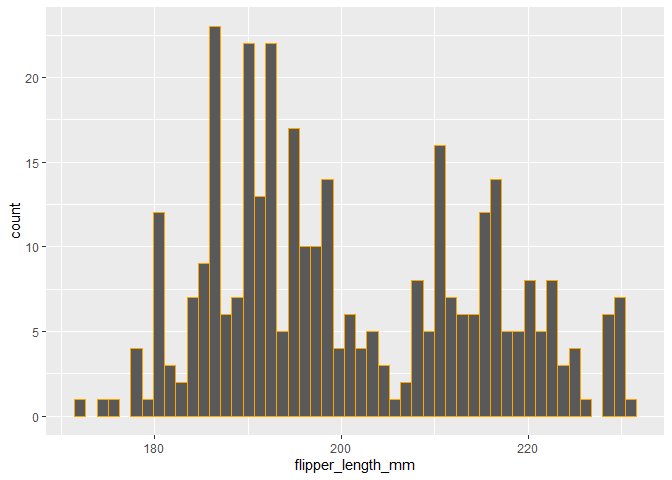
#output currently like this for 0's
p <- palmerpenguins::penguins |>
  ggplot() +
  geom_histogram(
    aes(x = flipper_length_mm),
    colour = "orange",
    bins = 50,
  )

p
#> Warning: Removed 2 rows containing non-finite outside the scale range
#> (`stat_bin()`).
#would prefer the 0's looked like this
layer_data(p) |>
  filter(ymax != 0) |>
  ggplot() +
  geom_rect(
    aes(xmin = xmin, xmax = xmax, ymin = ymin, ymax = ymax),
    colour = "orange",
    ) +
  labs(x = "flipper_length_mm", y = "count")
#> Warning: Removed 2 rows containing non-finite outside the scale range
#> (`stat_bin()`).
Created on 2025-09-19 with reprex v2.1.1