Replies: 3 comments 4 replies
-
|
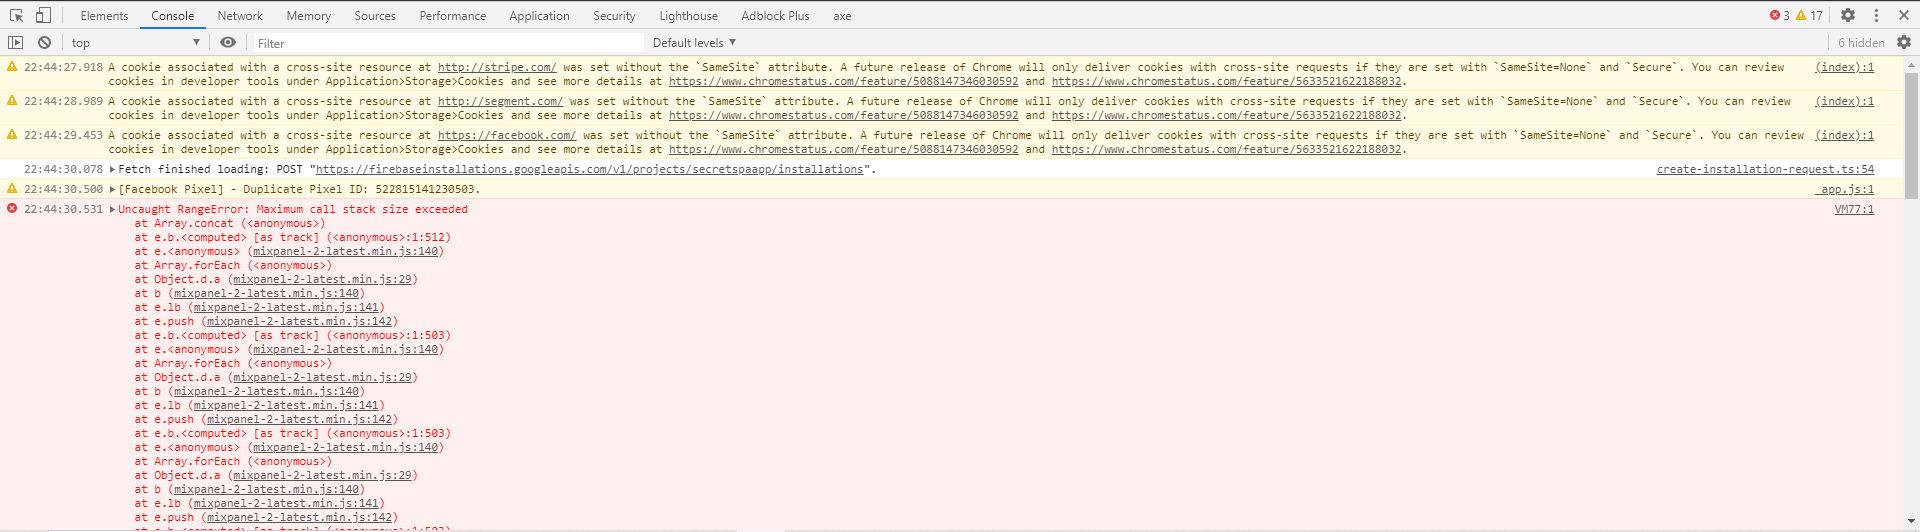
I see some error while loading the page |
Beta Was this translation helpful? Give feedback.
-
|
That's strange, I don't see any error. What browser are you using? |
Beta Was this translation helpful? Give feedback.
-
|
google chrome browser |
Beta Was this translation helpful? Give feedback.
-
|
I still get the same score with that issue fixed: https://web-booking.staging.secretspa.io (password is ssvip) |
Beta Was this translation helpful? Give feedback.
-
|
The main reason why you're getting a 0 is that you're serving uncompressed assets. The initial network request was 3.7MB, which is abnormally high for a user landing on a front page that just contains an SVG image, some text, and an input box. At the very least, your JS, CSS and HTML assets should be gzipped compressed (this article talks about enabling gzip on an Apache server, however, you'll need to research how to do it with your set up). Another reason this initial network request can be so large is that your main chunk maybe importing an entire library, but only utilizing a small portion of it (just a guess without a chunk graph -- this plugin will help you determine how your bundle is chunked). Another reason you have low results is that your server doesn't appear to be set up properly. For example, it's not caching assets nor does it handle HTTP redirects. |
Beta Was this translation helpful? Give feedback.
-
|
Thanks for the suggestions. I am hosting the site on Google App Engine so I thought the gzip would be handled for me. The 3.7mb is because behind the splash screen is the full website, so it's not just a splash screen! |
Beta Was this translation helpful? Give feedback.
-
Performance is important!!! |
Beta Was this translation helpful? Give feedback.
Uh oh!
There was an error while loading. Please reload this page.
Uh oh!
There was an error while loading. Please reload this page.
-
I am having an issue where Lighthouse is reporting a performance score of 0 and a 22 second page load time. However when I load the website in my browse it has a 1-2 second load time. See the lighthouse score below:
Why am I seeing such a large discrepancy?
The website in question is hosted here: https://web-booking.staging.secretspa.io/
Beta Was this translation helpful? Give feedback.
All reactions