Regarding netmoss score and p-value and their interpretation #6
Description
Hi,
My relative abundance table reads like this:
| genus | control-1 | control-2 | case-1 | case-2 |
|---|---|---|---|---|
| Colwellia | 0.51 | 0.35 | 43.3 | 56.4 |
| Pseudoalteromonas | 0.98 | 0.64 | 23.33 | 24.7 |
| Cohaesibacter | 0.07 | 0.05 | 0.07 | 0.1 |
| xxxx | xx | xx | xx | xx |
Netmoss results
| taxon_names | NetMoss_Score | p.val | p.adj |
|---|---|---|---|
| Colwellia | 1 | 0 | 0 |
| Pseudoalteromonas | 0.631 | 2.71E-147 | 6.53E-147 |
| Cohaesibacter | 1 | 0.607737938 | 0.61471341 |
| .... | ... | ... | .. |
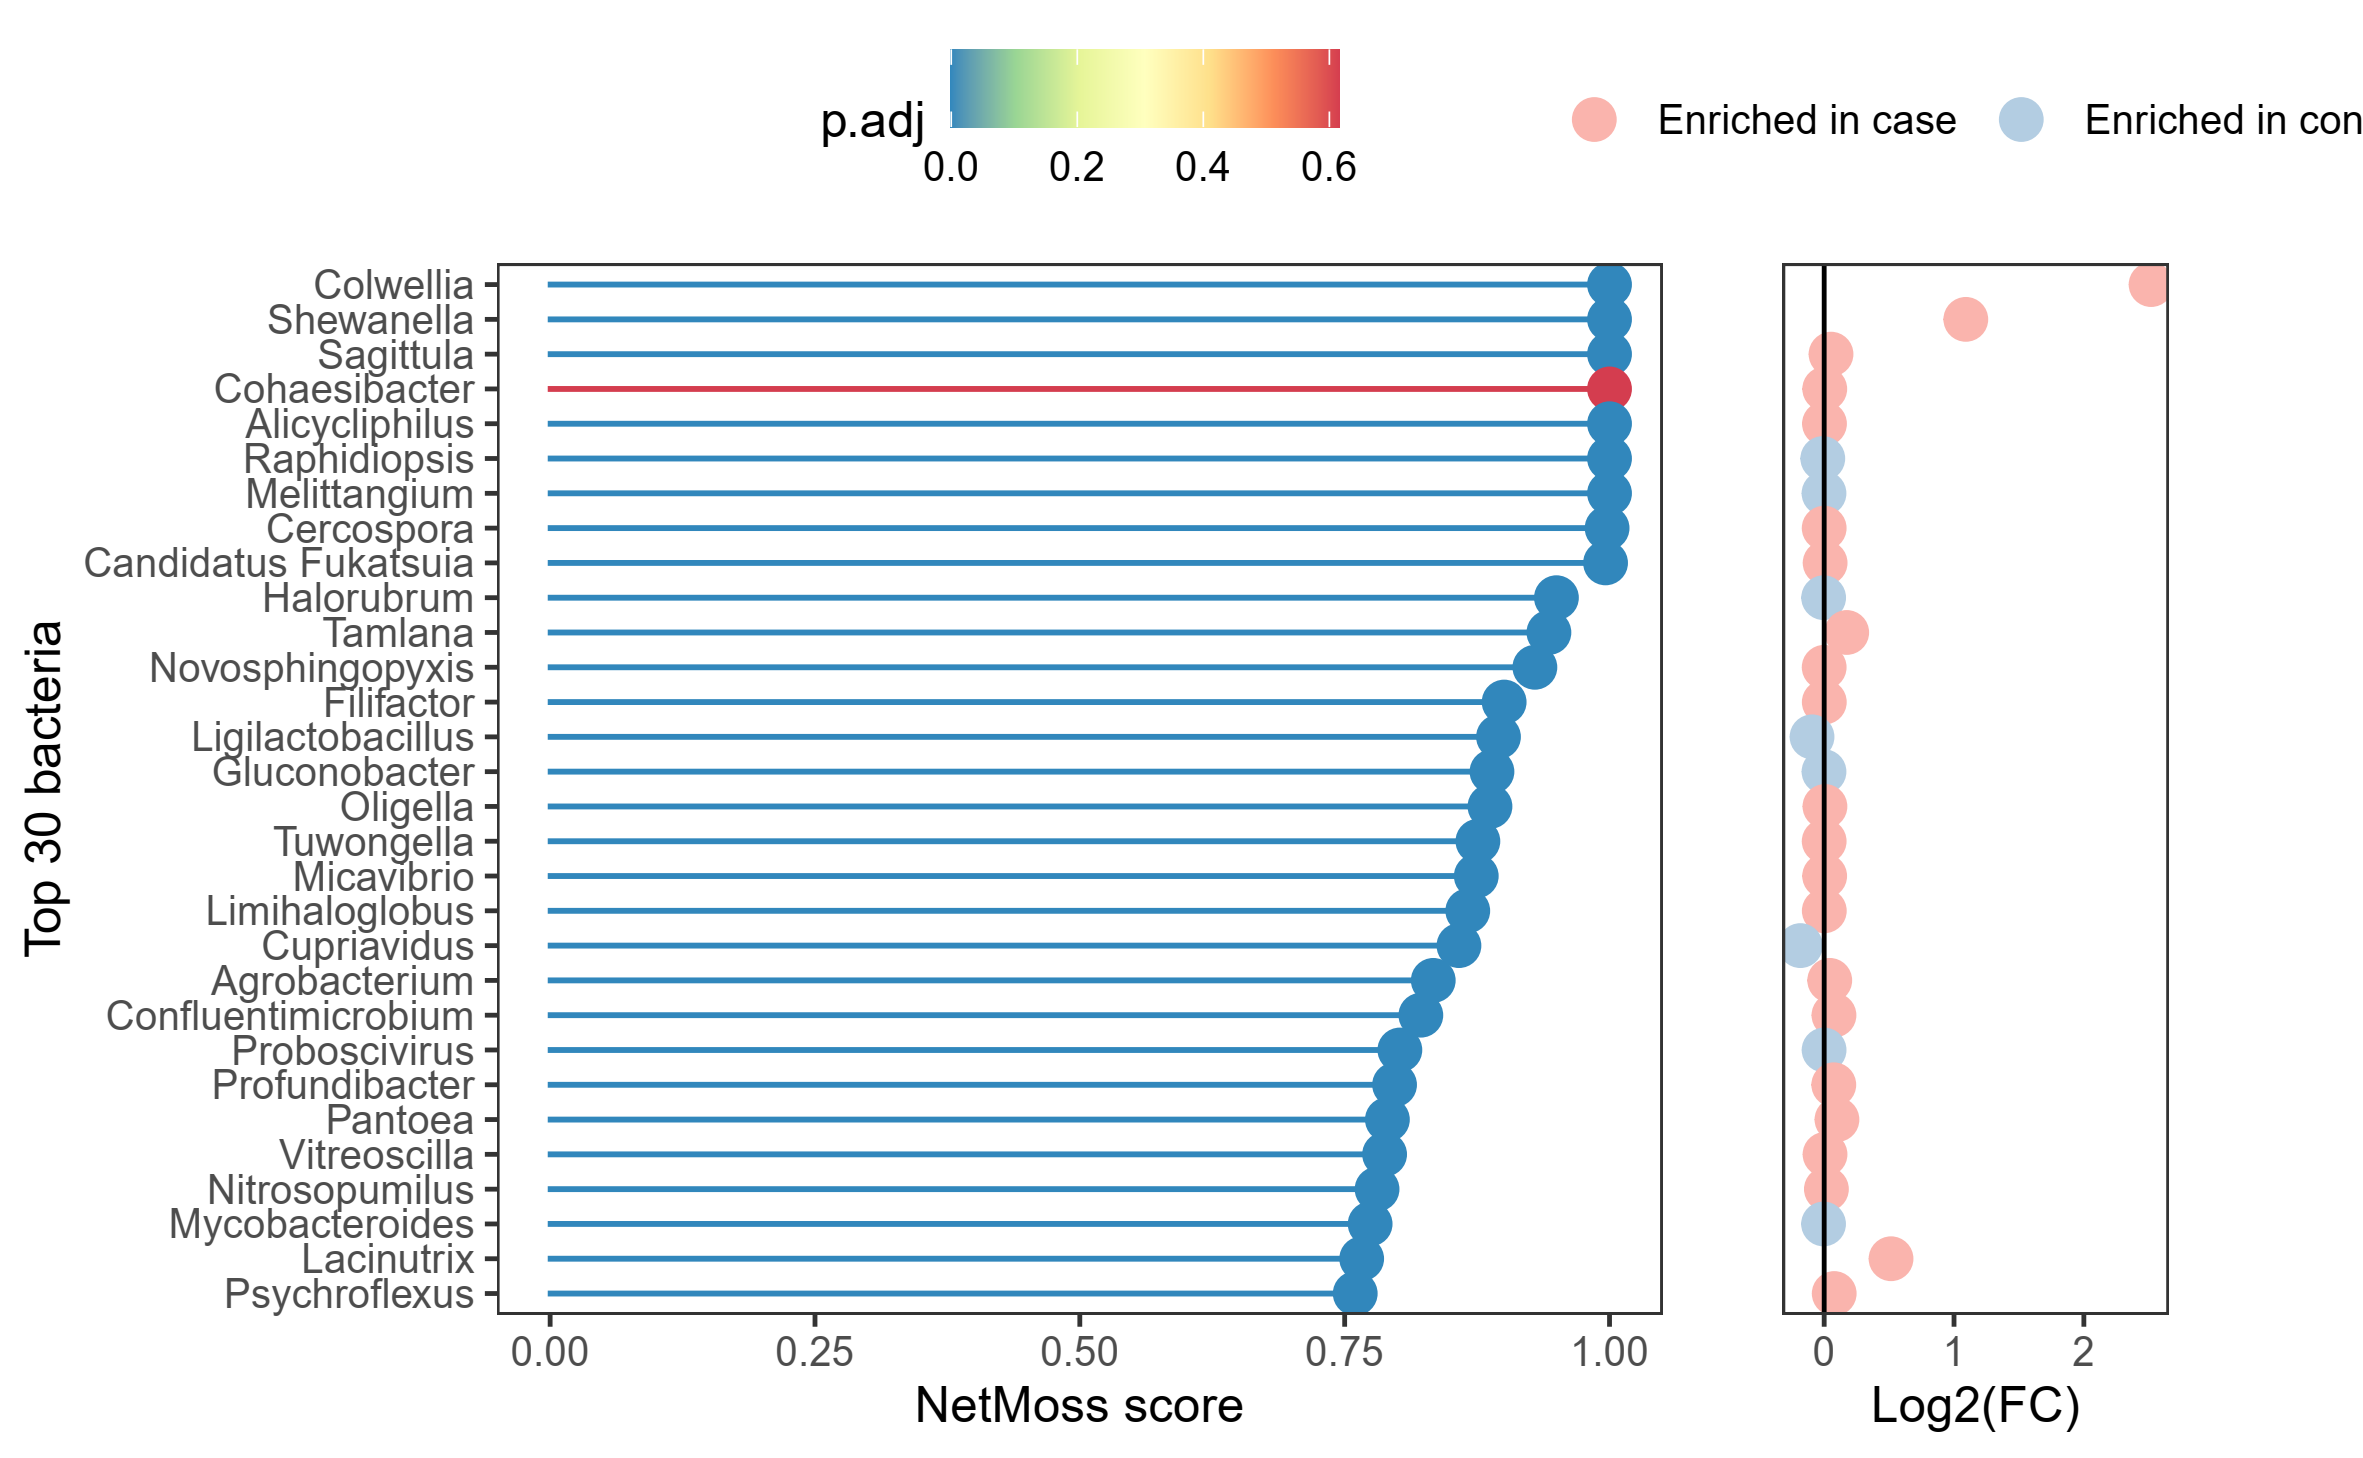
Here the first two genera (Colwellia and Pseudoalteromonas) were highly abundant in CASE samples (relative abundance table). Once I run Netmoss I cannot see their significance (below image). Although Colwellia was enriched in CASE with a high netmoss score, the p-value is insignificant. On the other hand, Cohaesibacter which did not show much change in its abundance between the two samples (control vs case) shows significantly enriched (with the same netmoss score as that of Collwelia but zero log2FC).
here, which parameter (netmoss score, p-value (adj.) and Log2FC) is to be considered?
Also why Cohaesibacter in the above table have higher netmoss score and p-value than the other two genera (whose relative percentage increased highly in CASE samples)
Note: I run netmoss2 using default parameters