Sampling profiler #29304
Description
I wrote a (very) initial PoC for a sampling profiler (tested on qemu_x86_64). A friend of mine @JonBruchim uses Zephyr and has had some performance issues. I saw that while Zephyr has some tracing/profiling tools, it doesn't have a sampling profiler. Myself, a frequent user of Linux's perf, I wanted to toy with creating a sampling profiler from scratch, for an existing system. Figured it's a good opportunity :).
So this PoC is:
- a sampling profiler based on existing clock updates that generates the call stack via fp-based unwinding.
- the "profiler" can be enabled for a specified duration using the shell command
perf record <duration ms>. - the shell command
perf printbufdumps the recorded samples. - the samples are then converted with a Python script to the "collapsed" stacks format as used by flamegraph.pl; you can then use
flamegraph.plto get a flamegraph.
I believe it's useful addition to Zephyr's profiling capabilities, hence I'm sharing it here as a feature idea.
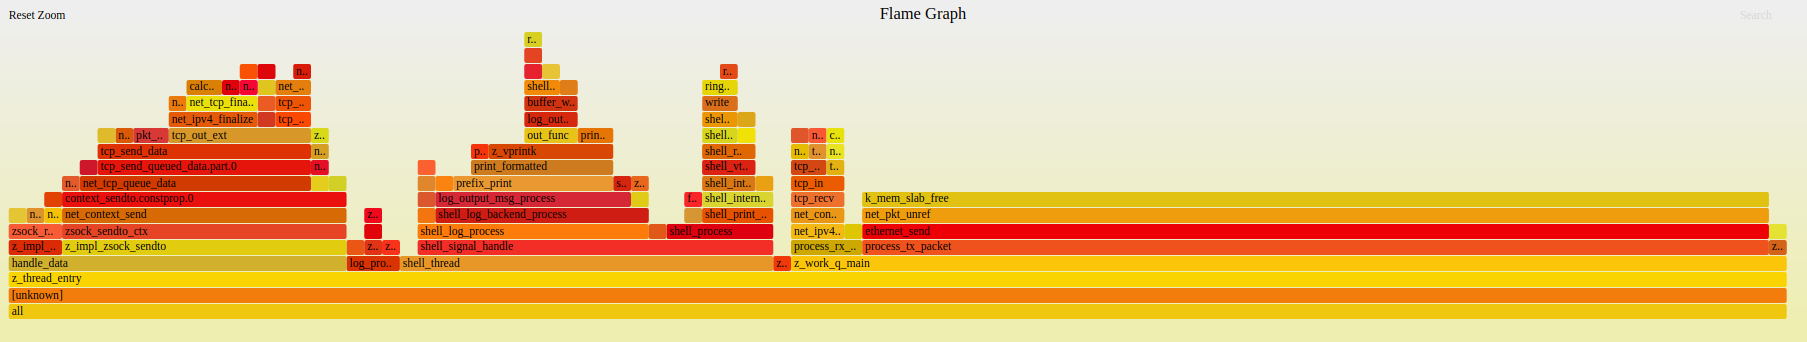
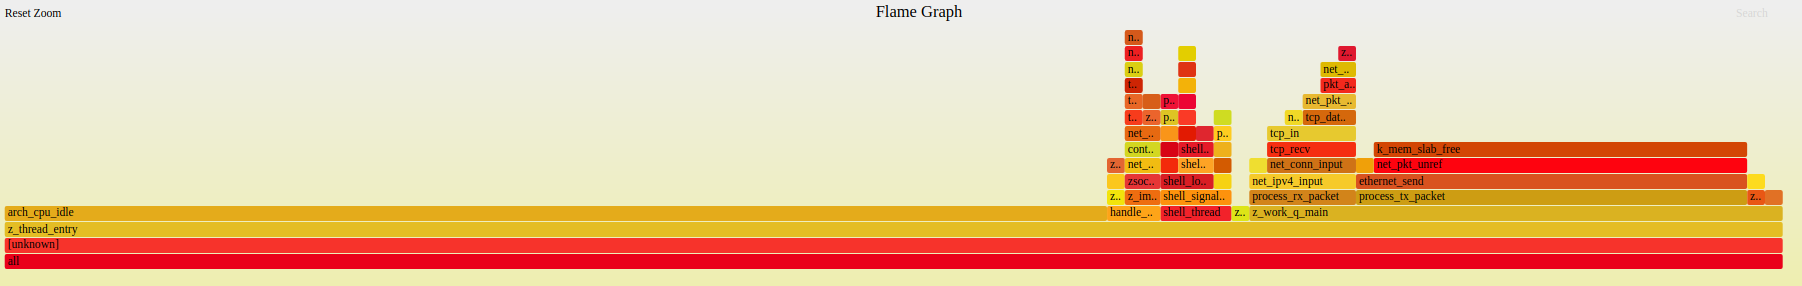
For example, here are some graphs generated from the net/sockets/echo_server sample:
Under heavy load:
More lightweight:
(Not sharing the .svgs because GitHub doesn't support uploading these 😢 )
Not sure what k_mem_slab_free is doing there so long, perhaps the simplistic stack unwinding is lying? Anyway, other stacks make sense to me.
It currently requires the following configs:
CONFIG_SMP=nsince it's simpler, SMP can be supported by employing a per-CPU sampling buffer or by maintaining safe concurrent access to the single buffer, with locks.CONFIG_TICKLESS_KERNEL=nsoz_clock_announceis called at set intervals.- Made sure the system builds with frame pointer (used for unwinding).
CONFIG_THREAD_STACK_INFO=yso I can accesscurrent's registers easily.
You can see the current work in the perf branch of my Zephyr fork.
If you think such a profiler fits in Zephyr, I'd be happy to continue working on it towards mainlining :)
Here are the next steps as I see it:
- Incorporate it into the tracing subsystem of Zephyr.
- Support SMP by creating a per-CPU sampling buffer (then allow profiling only a set of the CPUs, ...)
- When enabling perf, reconfigure timer interrupts to get any "frequency" we wish (currently it just uses the existing frequency, 100 HZ which is the default
CONFIG_SYS_CLOCK_TICKS_PER_SEC). This will also allow to work in tandem withCONFIG_TICKLESS_KERNEL: for the duration of perf, we will enable timer interrupts in the set interval, then disable and move back to "tickless". - Think of a way to stream samples (from a background thread) so the samples buffer doesn't fill up (Linux's
perfoccasionally reads the buffer and appends to a file, I think for Zephyr it would be better to stream samples over UART/network connection, but writing to a file might also do). - Test on some real hardware.
- Fix existing crashes / hangs 😅 I'm a Zephyr novice so I don't even know if these are related to my changes or not, but I did get a few hangs while operating this feature.
P.S it won't let me add labels, I guess the appropriate ones are Feature and area: Profiling.