Replies: 1 comment 3 replies
-
|
@pletch You mean this? https://zwave-js.github.io/node-zwave-js/#/api/controller?id=quotstatistics-updatedquot And https://zwave-js.github.io/node-zwave-js/#/api/node?id=quotstatistics-updatedquot |
Beta Was this translation helpful? Give feedback.
-
|
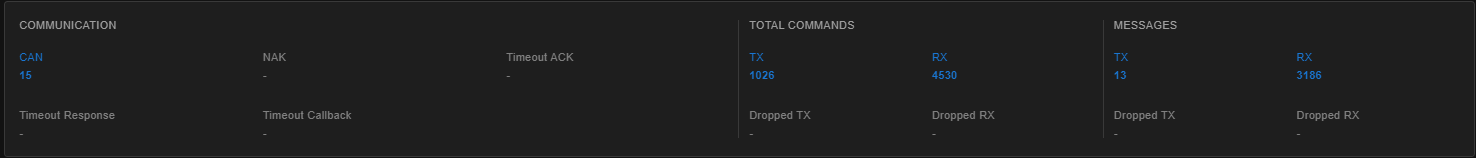
Thank you for pointing me to those. For example, This means the driver sent a message or command to the controller and the controller never responded? Is this because the driver likely sent a bunch of commands in succession and the controller can only handle so many incoming commands due to some buffer size limitation or controller load limitation? Is it normal to see these at some rate in a healthy z-wave environment? For example, here are my current statistics with about 30 devices in the mesh. |
Beta Was this translation helpful? Give feedback.
-
|
@pletch Blue stats in general are stats that are not to be considered 'bad' any value they have so everything looks ok here. @AlCalzone feel free to add some context to my answer if needed |
Beta Was this translation helpful? Give feedback.
-
The comment is above each field: CAN isn't bad, since it is a way of controlling the message flow between the controller (stick) and Z-Wave JS. It can happen that both are trying to talk at the same time, but the protocol doesn't allow that. |
Beta Was this translation helpful? Give feedback.
Uh oh!
There was an error while loading. Please reload this page.
-
Is there a good resource that helps explain high level meaning / interpretation / implication of the various controller statistics metrics to the non-RF / communication protocol engineer? I have done some general searching and looked at some of the Z-wave protocol documentation but haven't stumbled across anything that makes it clear to a general end-user.
For example under communication the metric 'CAN' is blue which I assume means these are not "bad" to have occurring at some frequency. What does 'CAN' mean with respect to the network? Is there a rate above which these become a concern (e.g. as function of network size and number of commands)?
What does a 'NAK' / 'Timeout ACK' / 'Timeout Response' / 'Timeout Callback' imply? Is it a sign of a protocol implementation issue, a misbehaving non-compliant node device, or a controller on the fritz? Will these occur independently of dropped TX/RX commands or messages?
Are dropped TX/RX commands / messages the primary indicators of a poorly behaving RF network?
Perhaps some of this detail could be added to a section in the documentation or provided when hovering over the metrics through a small pop up in the interface.
Cheers!
Beta Was this translation helpful? Give feedback.
All reactions