

Quick Start | Inputs | Options Reference
Generate activity graph cards using GitHub Readme Activity Graph within your GitHub Actions workflow. The output is automatically published to a dedicated branch, keeping your main history clean and ready to embed in your README.
name: Update Activity Graph

on:
  schedule: # execute every 12 hours
    - cron: "* */12 * * *"
  workflow_dispatch:

jobs:
  build:
    runs-on: ubuntu-latest

    permissions:
      contents: write

    steps:
      - uses: actions/checkout@v6

      - name: Generate activity graph
        uses: maurodesouza/github-readme-activity-graph-action@v1
        with:
          username: ${{ github.repository_owner }}
          options: theme=dracula&hide_border=true
          output_path: dist/activity-graph.svg
          token: ${{ secrets.GITHUB_TOKEN }}

      - name: Push activity-graph.svg to the output branch
        uses: crazy-max/ghaction-github-pages@v3.1.0
        with:
          target_branch: output
          build_dir: dist
        env:
          GITHUB_TOKEN: ${{ secrets.GITHUB_TOKEN }}
Then embed from your profile README:
| Input | Description | Required | Default |
|---|---|---|---|
username |
GitHub username to generate the activity graph for | true |
- |
options |
Card options as a query string (key=value&...) or JSON |
false |
"" |
output_path |
Output path for the SVG file (relative path; include filename with .svg) | false |
"" (defaults to dist/activity-graph.svg) |
token |
GitHub token (PAT or GITHUB_TOKEN). Falls back to github.token if not provided |
false |
"" |
| Argument | Description | Type |
|---|---|---|
bg_color |
Card's background color | hex code (without #) |
border_color |
Card's border color | hex code (without #) |
color |
Graph card's text color | hex code (without #) |
title_color |
Graph card's title color | hex code (without #) |
line |
Graph's line color | hex code (without #) |
point |
Color of points on line graph | hex code (without #) |
area_color |
Color of the area under the graph | hex code (without #) |
area |
Shows area under the graph | boolean (default: false) |
hide_border |
Makes the border of the graph transparent | boolean (default: false) |
hide_title |
Sets the title to an empty string | boolean (default: false) |
custom_title |
Set the title to any string (use %20 for spaces) |
string |
theme |
Name of available theme | string |
radius |
Border radius of graph | number (0-16) |
height |
Height of the graph | number (200-600) |
days |
Number of days to display on graph | number (1-90, recommended below 40) |
from |
Date from which the graph starts | format YYYY-MM-DD |
to |
Date where the graph will end | format YYYY-MM-DD |
grid |
Show grid | boolean (default: true) |
For the full list of customization options, check the original project.
| Name | Preview |
|---|---|
| Default (cotton candy) | 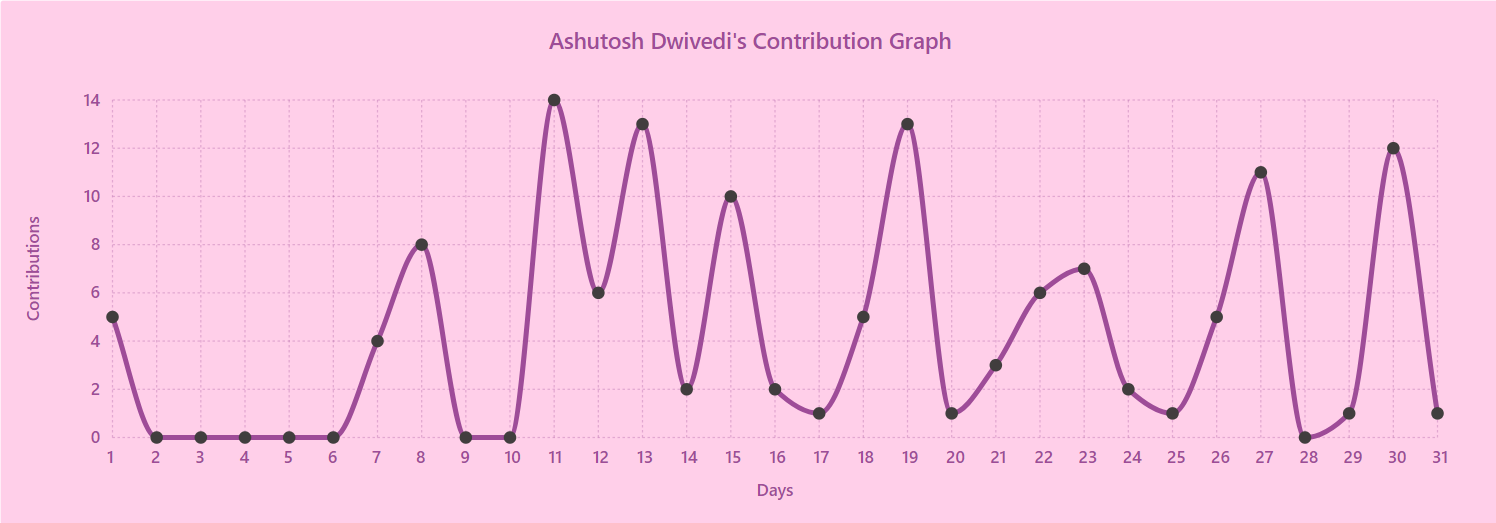 |
| react | 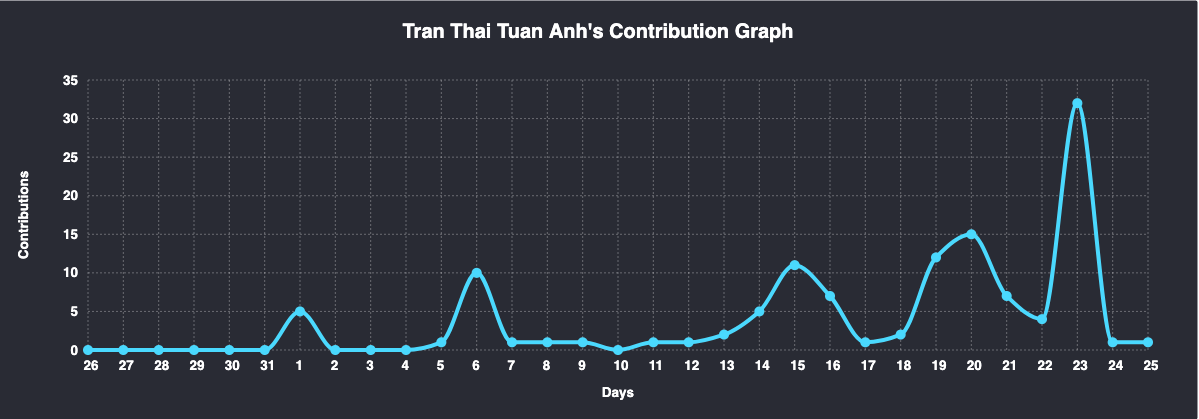 |
| react-dark | 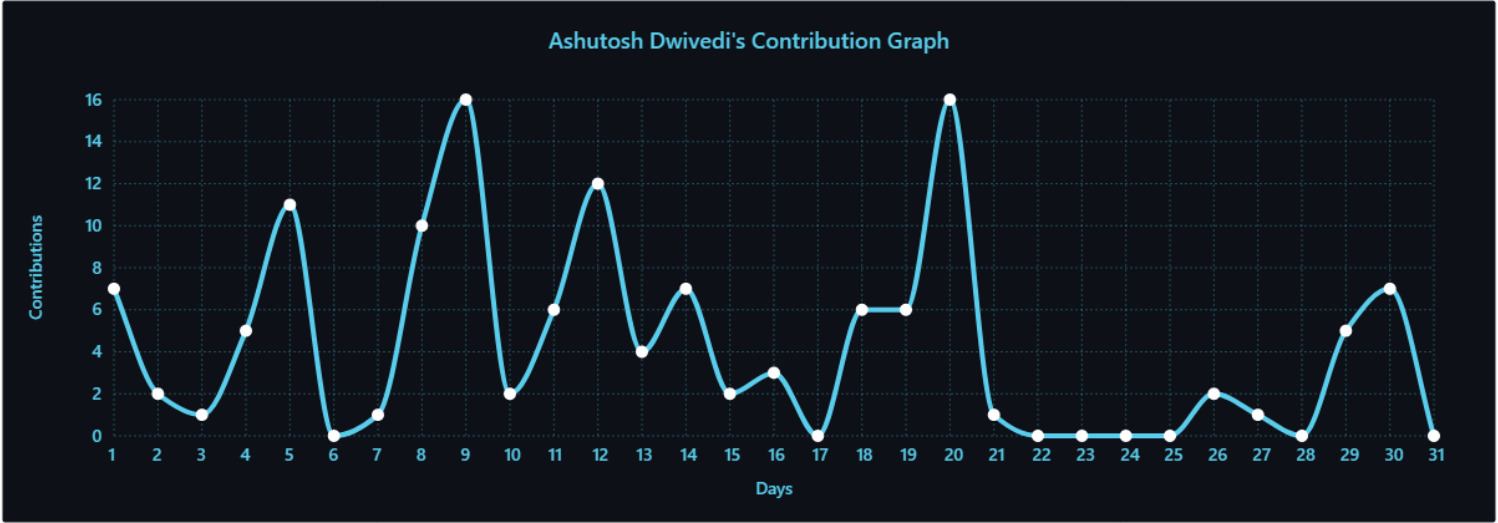 |
| github | 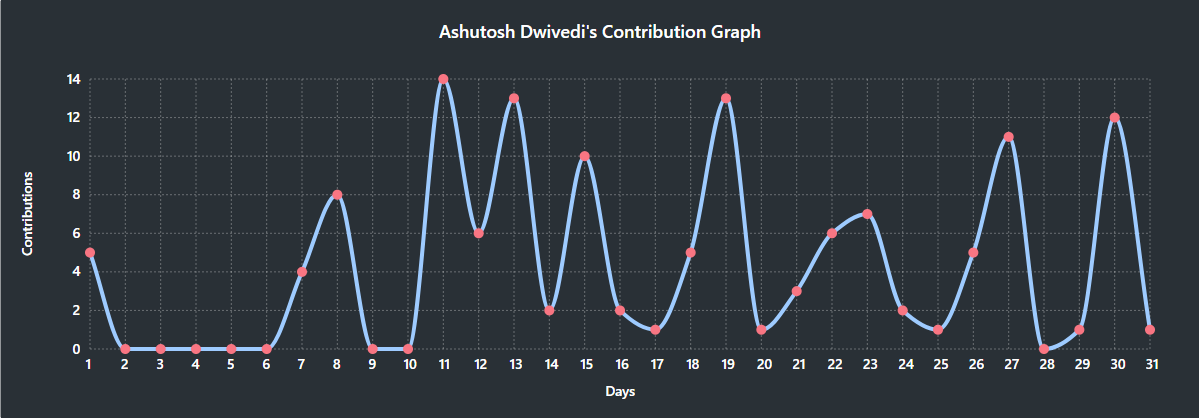 |
| github-compact | 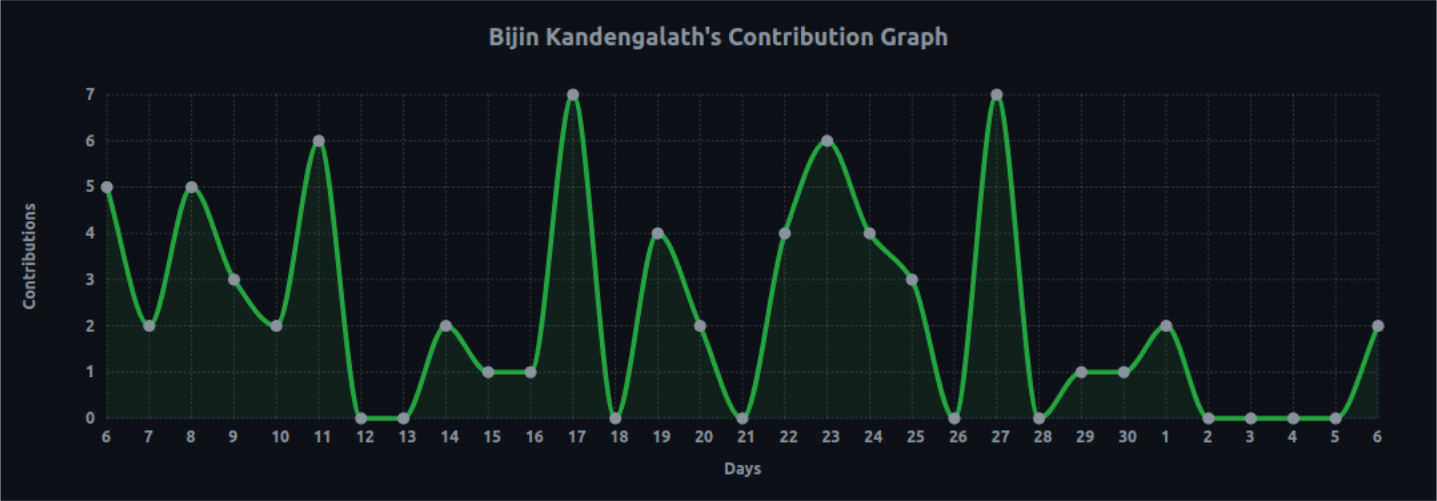 |
| xcode | 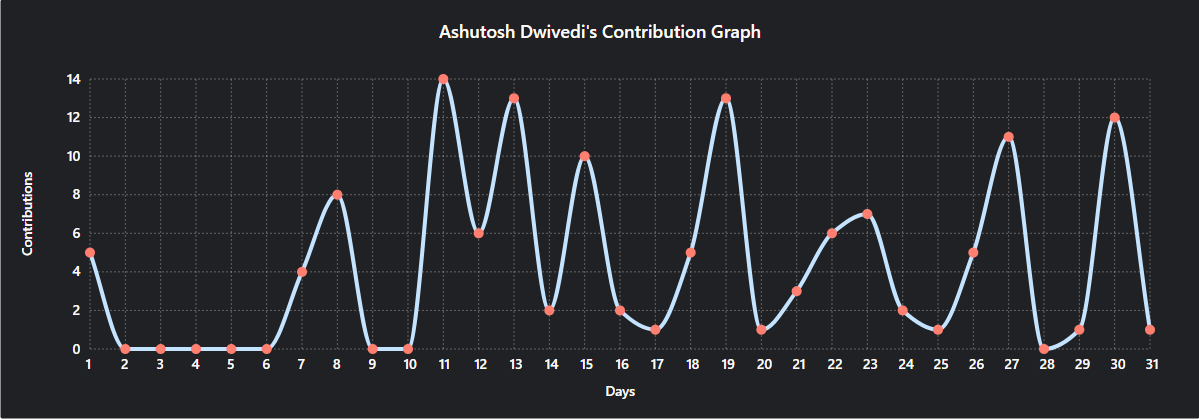 |
| rogue | 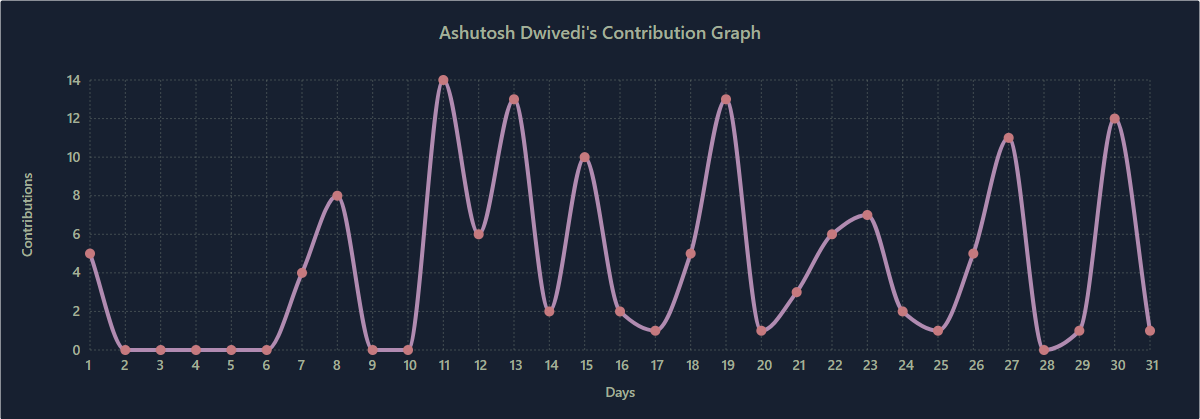 |
| merko | 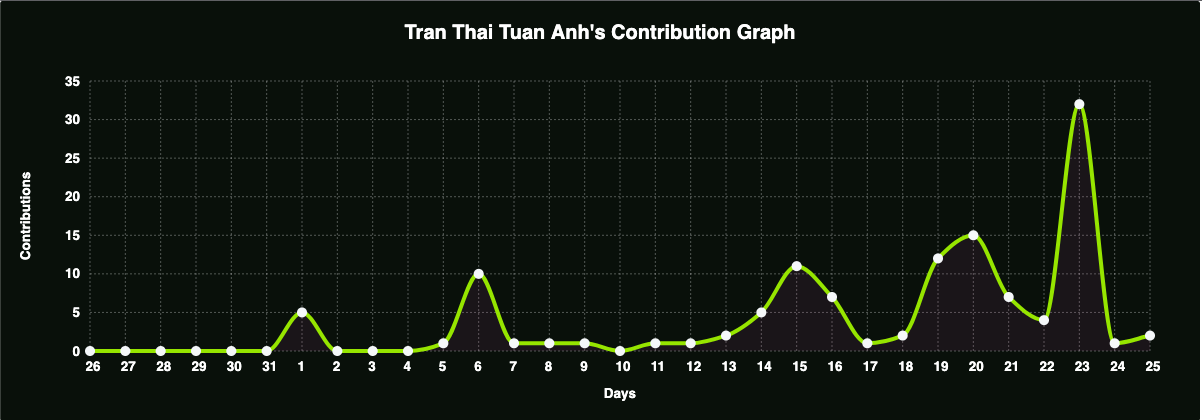 |
| vue | 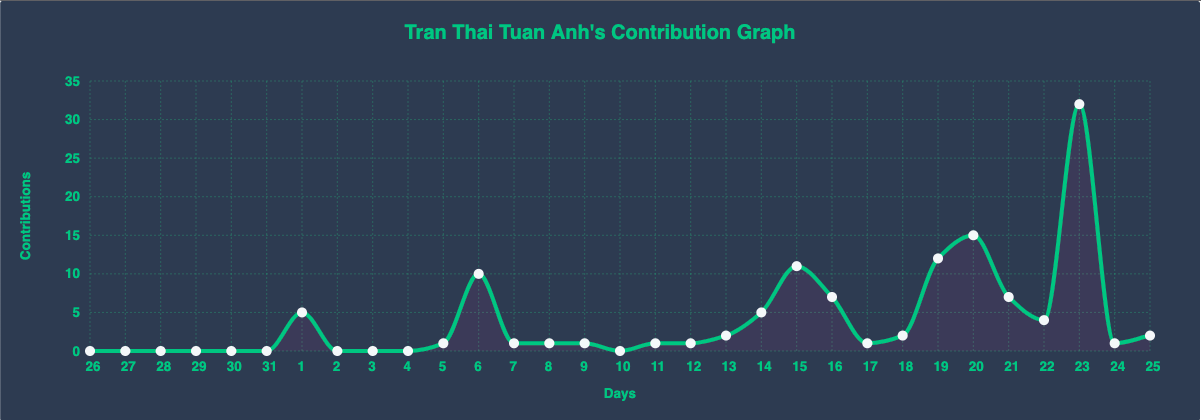 |
| tokyo-night | 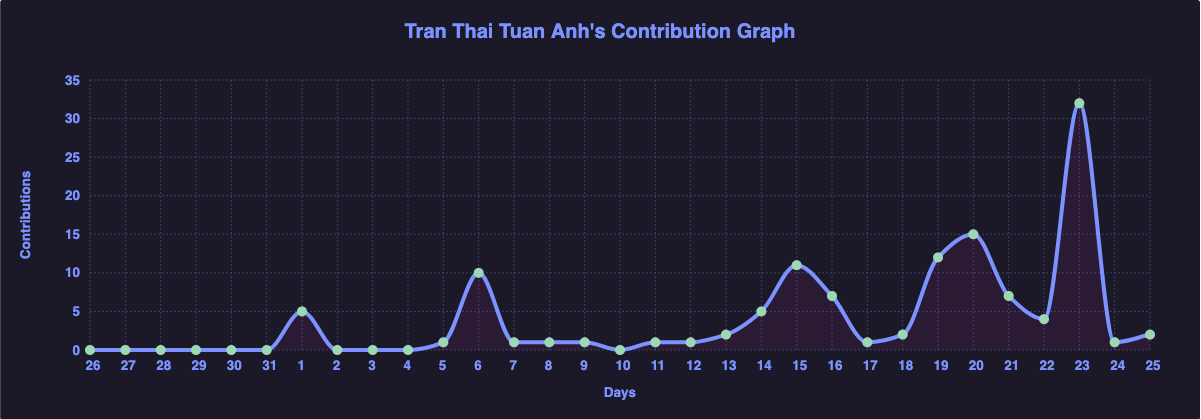 |
| high-contrast | 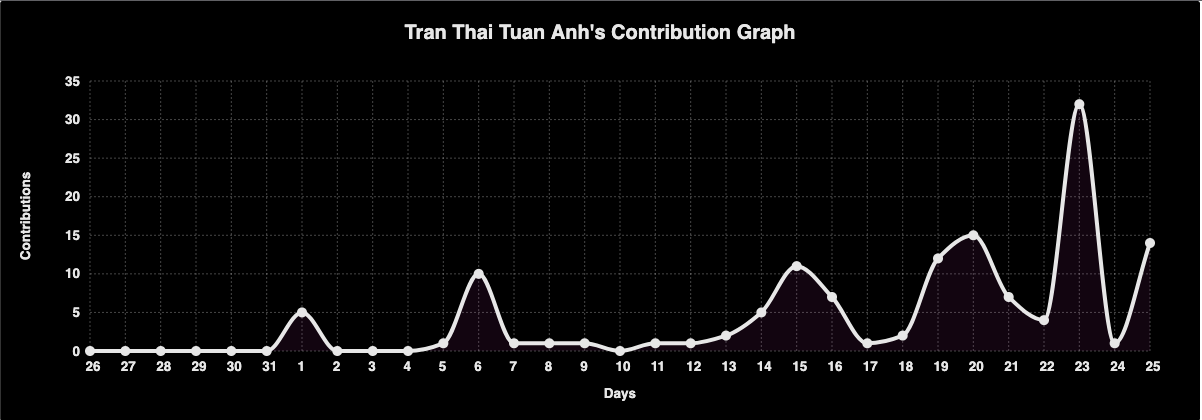 |
For more themes, check the original project.
This project is licensed under the MIT License. For more details, please refer to the LICENSE file.
Made with ❤️ by Mauro de Souza.
Based on GitHub Readme Activity Graph by Ashutosh00710.
Readme created with Simple Readme