Sudarshan Sampathkumar
This project is done as part of the course CIS 6930 Information Security in Distributed Systems. The main objective of this project is to demonstrate if we can statistically distinguish the internet usages of two different users over time. The project is developed in the Python3 programming language. Please make sure you have the Python installed on your computer.
This project requires some external libraries that may not be included with the Python installation. If you don’t have the libraries, please install the following modules before proceeding.
- SciPy
- Pandas
- Sqlite3
- Csv
To further ease the understanding of this project, I have included this section that gives a brief introduction to the file structure of the project.
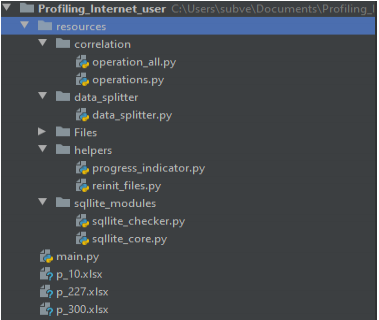
The project is divided into 5 modules: -
- Correlation
- Data Splitter
- Files
- Helpers
- SQLite Modules
The main function is located at the parent directory. All these 5 modules are grouped into one single module called Resources. Each of these 5 modules has python files that encapsulate several procedures. Feel free to check out the comments on the code for a better understanding of every function.
To quicken the process of this execution, I took the freedom to already import and split the data into the three specified time windows; 10, 227, and 300 seconds. Hence by running this command, the project will skip to the calculation of the Spearman correlation algorithms and the P Values. To execute the python file, please navigate to the parent directory where main.py is present and type the following:
python main.py
Or you can simply double click on the python file to execute it on Windows.
The program comes with cached dataset. If you wish to test the project from scratch, then please follow these instructions carefully to avoid any errors.
-
Navigate to Resources/ Files and move or delete the users.db file.
-
Go to the command prompt or terminal and set the current directory as the parent directory
-
Run the same command with a command-line argument
re_init
python main.py re_init
If you’re using PyCharm IDE to test the project, I have already added two configurations
for you. The main configuration will handle the operation part with the data that has been
imported and split with, to reduce run time. On the other hand, the main_init will run the project
from scratch. Make sure, you delete the users.db file by following the bullet point instructions
given above. If by any chance, you don’t find the configuration due to compatibility issues, please
add the main.py to your configuration.
For Linux OS, type the following command in the terminal from the parent directory.
$ python main.py
If you want to run it with the parameter,
$ python main.py re_init
If in any case, the program is failing to run, please read the last section Important Notes to look for a potential reason to why this is happening.
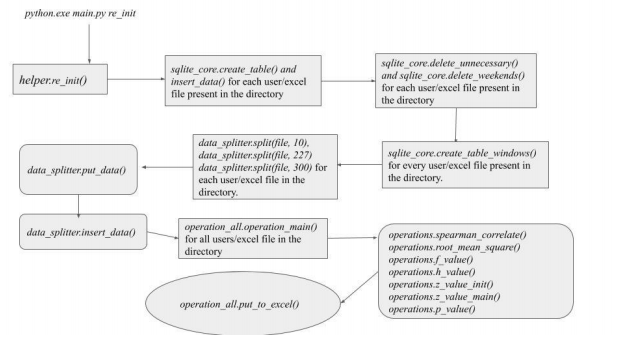
To completely understand the project’s workflow, I have included a workflow diagram that
may help you visualize the code flow with ease. To include all parts of the project, the diagram
will show the execution of the code when the project is run with re_init argument.
Workflow by points:
-
The python script executes the
sqllite_core.create_and_insert files()function for all the files in the directory when the argument re_init is passed. This function imports all the data into the SQLite database. -
Once the data is imported, the
delete_unecessary()anddelete_weekends()are called to delete data which is not a weekday and which is not between 8 am to 5 pm for weekdays. -
Now, for every user, two tables are created for each window. Here each table will consist of data of one week. Two tables for each window infers that every user will have 6 tables in total when you consider the other two windows as well. This is handled by the function
create_table_window()in the same module. -
In this step, the splitting happens. The splitting algorithm here forwards the start date to Monday if the data starts from Friday for the user. This algorithm creates a time window as provided in the argument and checks if the
real_first_packetfalls into the window or not. If yes, the octets/duration is calculated for that packet and appended to the existing result, if it exists. -
As week 2 starts, the
insert_data()function is called to insert the split data and its ratio for the first week into the corresponding table. The process repeats until week 2 ends and the next user is called. -
When this process completes, the
operation_all.operation_main()is called for all the users in the directory. Two files are compared at one time and the ratios of these files are fetched using the functionsqllite_core.get_split_ratio_datainoperations.pyfile. -
The
spearman\_correlate()calculates the correlation value of these two files. With the resulting values, theroot_mean_square()is used to calculate the root mean square values as the function name says. The f and h value is returned by the functionsf_value()andh_value(). -
Lastly, the z values are initialized by the
z_value_init()and thez_value_main()is called to calculate the main Z value. The Z value is then passed to the PFunction that was provided in the project documentation. -
Each P value is stored in a dictionary where the keys are the two users that are being compared.
-
The
put_to_excel()exports the dictionary into the corresponding excel sheet.
If you want to run just the operation part of the project, that is, if you’re running the script
without any argument, then the users.db file will serve as the input.
If you’re running the code with the re_init argument, the excel files will serve as the
primary input, however, in the end they are added to users.db files.
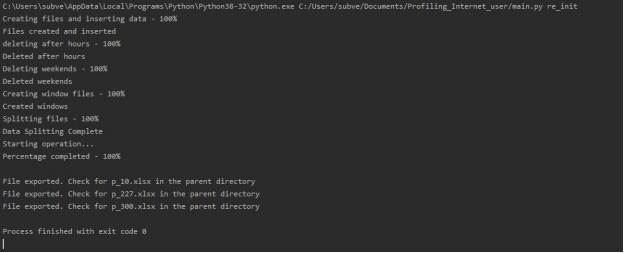
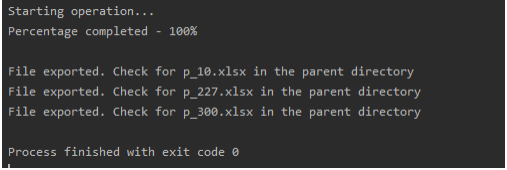
Irrespective of the way you would like to run the program, the output will always be three
excel files named p_10, p_227, and p_300 which will be generated in the parent directory.
**The output should look like this if you’re using the re_init.
The output would look like this if you’re running the main without an argument
This section, being the final section of this document, contains some possible human errors that may happen due to which the program could fail to run.
- Make sure all the excel files (.xlsx) are present in the Resources/Files folder.
- If you’re using the
re_initargument, please make sure that you delete or move the database file from the original position. - Do not keep any excel sheet open during the process of running. This action will not give the program the access to write and the program will crash.
- The
re_initwill significantly take a long time to run. Therefore, I recommend that you run it without the argument first.