This project allows security analysts to convert Zeek Agent endpoint logs and Zeek network logs into provenance graphs.
The displayed nodes and links are derived from the audit logs from Zeek-Agent (attach github link) which contains process, socket, file, network, and attribution of socket with network (zeek) events. Each of these events are stored in a seperate json log file, which can be easily linked/uploaded to elasticsearch.
To use Zeek-Agent Visualizer you need to be connected to elasticsearch running with ajax API that is configured for Cross-Origin Resource Sharing (CORS) and a recent web browser to display the visualization. Incase CORS is not enabled, you can change the elasticsearch CORS setting from the config/elasticsearch.yml file
http.cors.allow-origin: "/.*/"
http.cors.enabled: true
#you might want to use the regex for your local host instead of "/.*/" as a safer option
Each index in elasticsearch should have only one log file entry, each document in the table corresponds to a seperate log from a log file (e.g process.log containing process events).
For example the url: 'http://localhost:9200/file_index/_doc' will have 'file_index' as an index storing file event logs
You just need to change the name of the following indices corresponding to a label with your indices in the 'GraphConf.js' file
const file_index = 'file_index_attack';
const process_index = 'process_index';
const socket_index = 'socket_index_attack';
const zeek_index = 'zeek_index_attack';
const dhcp_index = 'dhcp_index_attack';
const dns_index = 'dns_index_attack';
const http_index = 'http_index_attack';
const ssl_index = 'ssl_index_attack';
const networkfile_index ='networkfile_index_attack';
Note: You must not manipulate any log entries in an index such as adding an id or timestamp.
Lastly, on your browser, just access the 'graphexp.html' file
For more details see the configuration file
Zeek-Agent Visualizer offers many features that were designed while keeping in mind the needs of an analyst tracing an attack or observing a potential attack behaviour through this Visualizer. The features include:
- Search-based on specific values or labels in general
- Node and edge information+exploration-all the relevant information of a node is displayed to the user
- Limit the number of nodes-limit to how many nodes you want to display and fetch from elastic search
- Layering-subgraphs to focus on latest events explored by dimming the non active nodes when new nodes are explored
- Merging-similar nodes are merged into one node which significantly reduces the size while maintaining causality
- Pinning a node-keep a track of important nodes which never vanish in the layering process
- Dynamic Positioning of nodes using d3.js- forces of physics come into action to display an ideal graph
- Freeze exploration- prevent exploration of nodes while analyzing node properties
- Hide nodes- only display the nodes that are more relevant to the analyst
- Forward and backward tracking options- an option that allows to explore graph in one direction in time
There are multiple ways to search and display nodes.
1)You can search on unique ids of process, file, socket, and zeek labels (nodes) assigned by elasticsearch
2)You can search on file name
3)You can search on process PID
When searching on any of the above node key, make sure the label filter is 'none' or corresponds to the label being searched. for example while searching for file name, the node label must be either 'none' or 'file' to display the corresponding node. By default the node label is 'none'.
When searching for a file, you can add "*" at the end of the file name to show results with similar file or directory names if any
If you do not know value of any of the above mentioned fields, then you can search on the basis of labels (process,socket,file,zeek) and all the nodes within a certain limit specified will be displayed. This can help give an analyst a good reference node that can be then specifically searched.
When searching solely on the basis of labels, ensure that the key value input field is empty
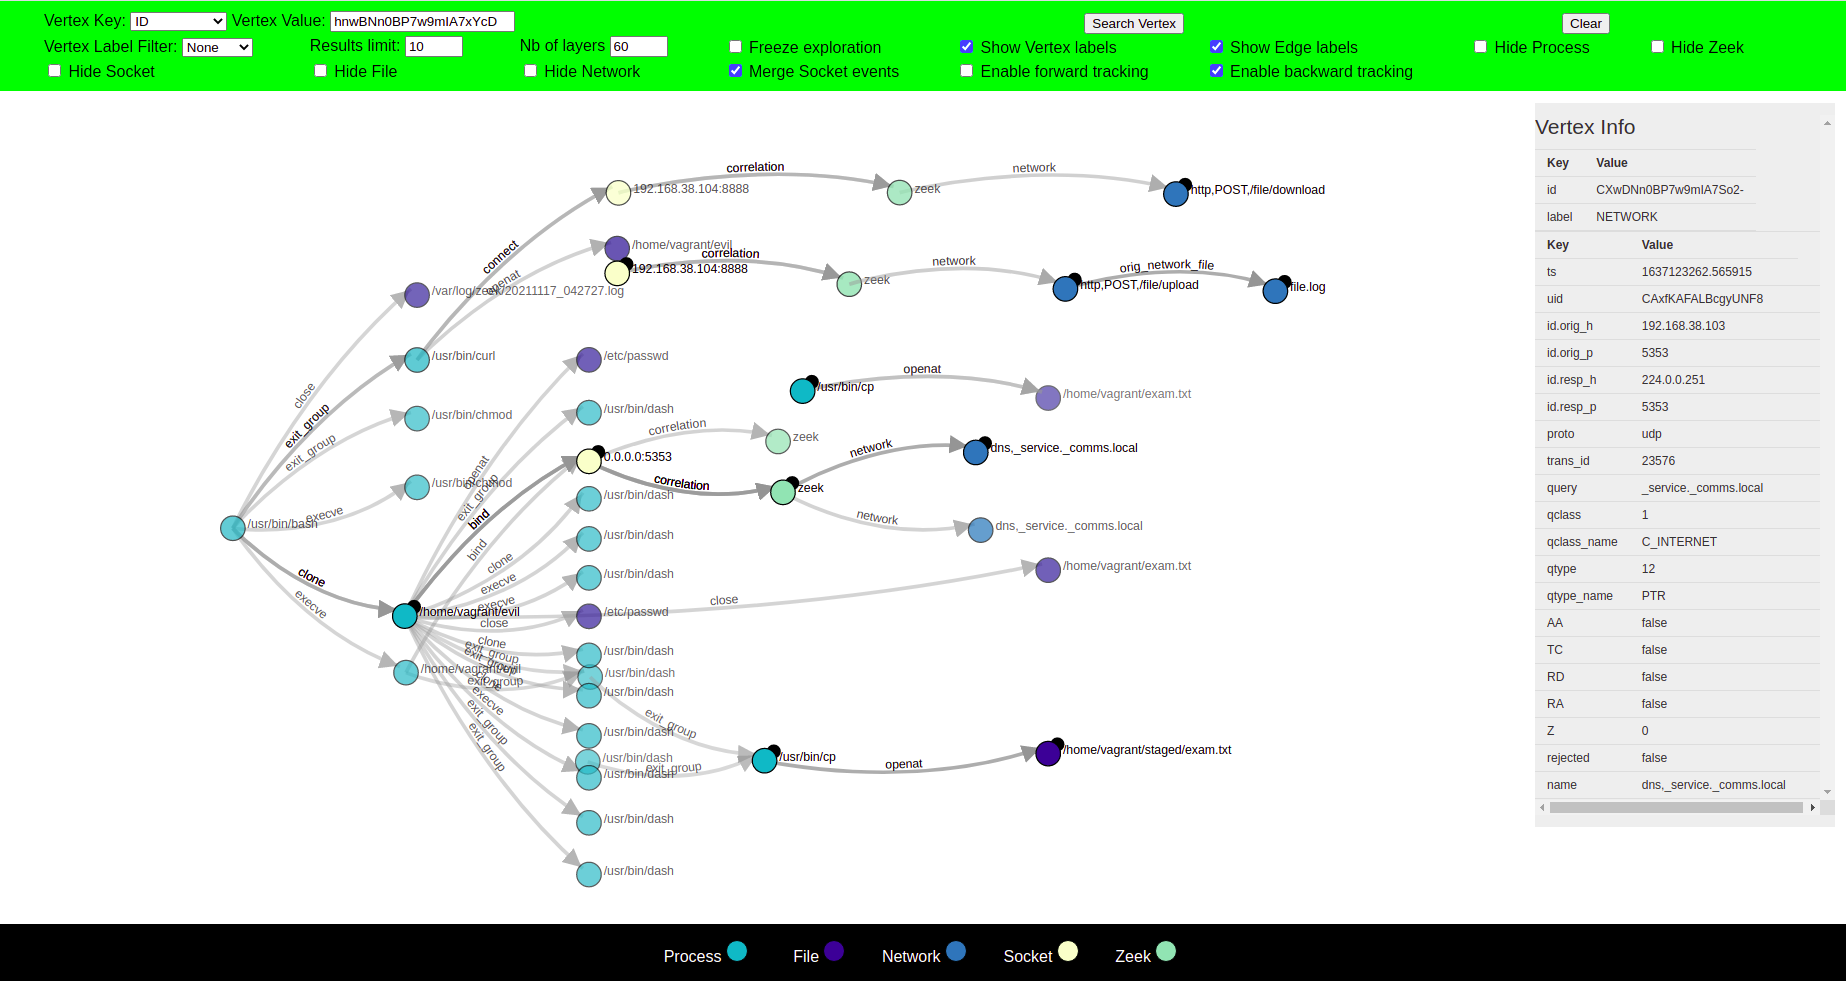
Clicking on a node forms a circle around the node, and its parent and child nodes are displayed, opening new paths for exploration.
The label of each node is displayed when the cursor is hovered over the node. Upon clicking the node, all the relevant information regarding that node is displayed on the right side. Two nodes are connected with an edge with a label that defines the action of the parent node that led to the creation of child node e.g a syscall or the label can be a general relationship between the nodes.
The graph is mostly explored in such a way that the parent node is displayed on the left side of the clicked node, and the child node is displayed on the right side of the clicked node. This helps to see the chain of events in time from left to right.
Since provenance graphs of system logs have the potential to generate millions of new nodes, it can overwhelm an analyst if displayed on an interface. Therefore, you can limit the number of entries that are displayed for each label from Result limit which is set on 30 by default. The default number can be changed from 'graphexp.html'.
Moreover, in the 'GraphConf.js' file you can also change the number of nodes that you want to retrieve from elastic search aswell as number of nodes you want to display for each label.
Our visualization tool uses the concept of layers of visualization, which aims to put a spotlight on certain subgraphs rather than displaying the whole graph during exploration. In this idea, if a user clicks a vertex, the visualizer will show its neighbors, expanding new layers (paths) for further exploration. While if a vertex is not clicked, then that vertex and its corresponding edges will slowly vanish as we progress in the exploration.
If the nodes completely vanish in the process, they can no longer be clicked, however, upon clicking a node that is vanishing, it and its neighbours become active and therefore bright again. A vanished node can come back to life again in the same position it was vanished at, if any of its neighbour is clicked. Layering can therefore help provide a precise, local view rather than a global one.
Zeek-Agent Visualizer also allows the user to control how many new layers can be explored before vanishing old layers.
Zeek-Agent Visualizer uses the concept of merging similar nodes into a single node. This significantly reduces the size of the graph without affecting the correctness of causal analysis.
Some nodes are more important than others and the user would not want them to vanish in the layering process, or would want to mark them for reference. You can do this by clicking on the small circle on the upper right side of the node. By pinning it, the node will never vanish unless you unpin it.
Zeek-Agent Visualizer relies on D3.js library for positioning of nodes. D3’s force layout uses a physics based simulator for positioning the visual elements of the graph. It simulates forces which allow you to control the position of nodes in relation to each other and the simulation. D3 forces can allow nodes to attract to repel and attract one another, nodes can be configured to attract to center of gravity. Moreover, a collision detection mechanism can prevent nodes to overlap one another. These are just some of the many options D3 offers to visualize a data set.
Since the simulation is aimed at visualizing the new nodes that were not previously part of the graph. In order to prevent overlapping of these new nodes with the old ones, Zeek-Agent Visualizer finds the closest positions for new nodes that have not been taken by any older node(s) along the x-axis.
When a node first appears it can be dragged and dropped to a new position where it can be fixed. This only works for the new displayed nodes (most recent layer with the node being displayed for the first time).
You can learn more about different forces and how to use them in a simulation from here.
Zeek-Agent Visualizer allows users to 'freeze' the graph at any time. This allows the users to click on the nodes and see its description without making it explore and display its neighbouring nodes.
The tool allows users to hide particular type of nodes so that they can focus on the more relevant type of nodes as per their requirement. For example, a user can hide all file nodes if it is not of interest to them. The graph will continue to explore the hidden node type(s) but will only display them if they choose to unhide them.

The user has the option to either only forward track, backward track or both when exploring.
In forward tracking only the children nodes will be explored and the graph will only move forward in time.
In backward tracking only the parent nodes will be explored and the graph will only move backward in time, this is particularly useful when the user does not want exploration of children nodes and is only interested to go back in time, for example, to view the initial infection point (IIP). Since there may be many children nodes as compared to probably a single parent node, this will help prevent the visualizer to display the many children nodes when clicking on a node.
At any point in time you can enable forward tracking and click on the node to observe its children nodes and vice versa.
By default both forward tracking and backward tracking have been enabled.
You can use the attack case tutorial to explore the visualizer.
The front-end of this project has taken its inspiration from graphexpx