

This is a package for the Umbraco CMS, written and tested in V16.2.0, although it likely works on other versions too :).
SBD stands for the initials of my name.
The package, as the name suggests, aims to help get insights about the content, so about the created documents and document types, with the help of Chart.js.
- Add a reference in you web project to the package, like this:
<PackageReference Include="SBD.ContentInsights" Version="1.0.0-beta.1" />
- Continue with the "Usage" section.
- Clone the repository.
- Either delete SBD.ContentInsights.TestSite and place your website there, or copy only SBD.ContentInsights and insert it into your project.
- Reference the
SBD.ContentInsightsproject from your web project. - Since the project is a Razor Class Library, the contents off
App_Pluginsshould be copied over automatically. - Continue with the "Usage" section.
- Start your website.
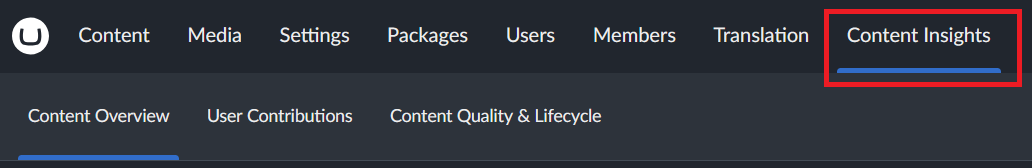
- There will be a new section called "Content Insights".
- Umbraco by default has an "Administrators" user group. The package will grant access to the section for this user group.
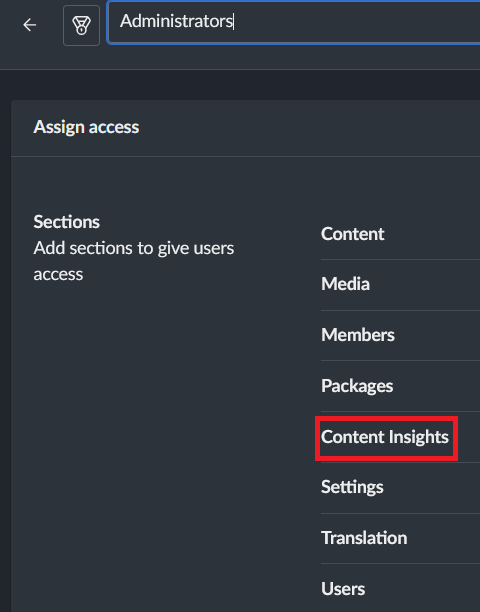
- There will be a new user group called "Content Insights Administrators". This user group only grants one access: access to the "Content Insights" section. Add users to this group to grant them access to the section.
- Permissions are checked during API calls too, so instead of granting a user group the section access, put the desired user into the "Content Insights Administrators" group. (The user needs to be in "Administrators" or "Content Insights Administrators").
Inside the "Content Insights" section there are three dashboards:
- Content Overview
- User Contributions
- Content Quality & Lifecycle
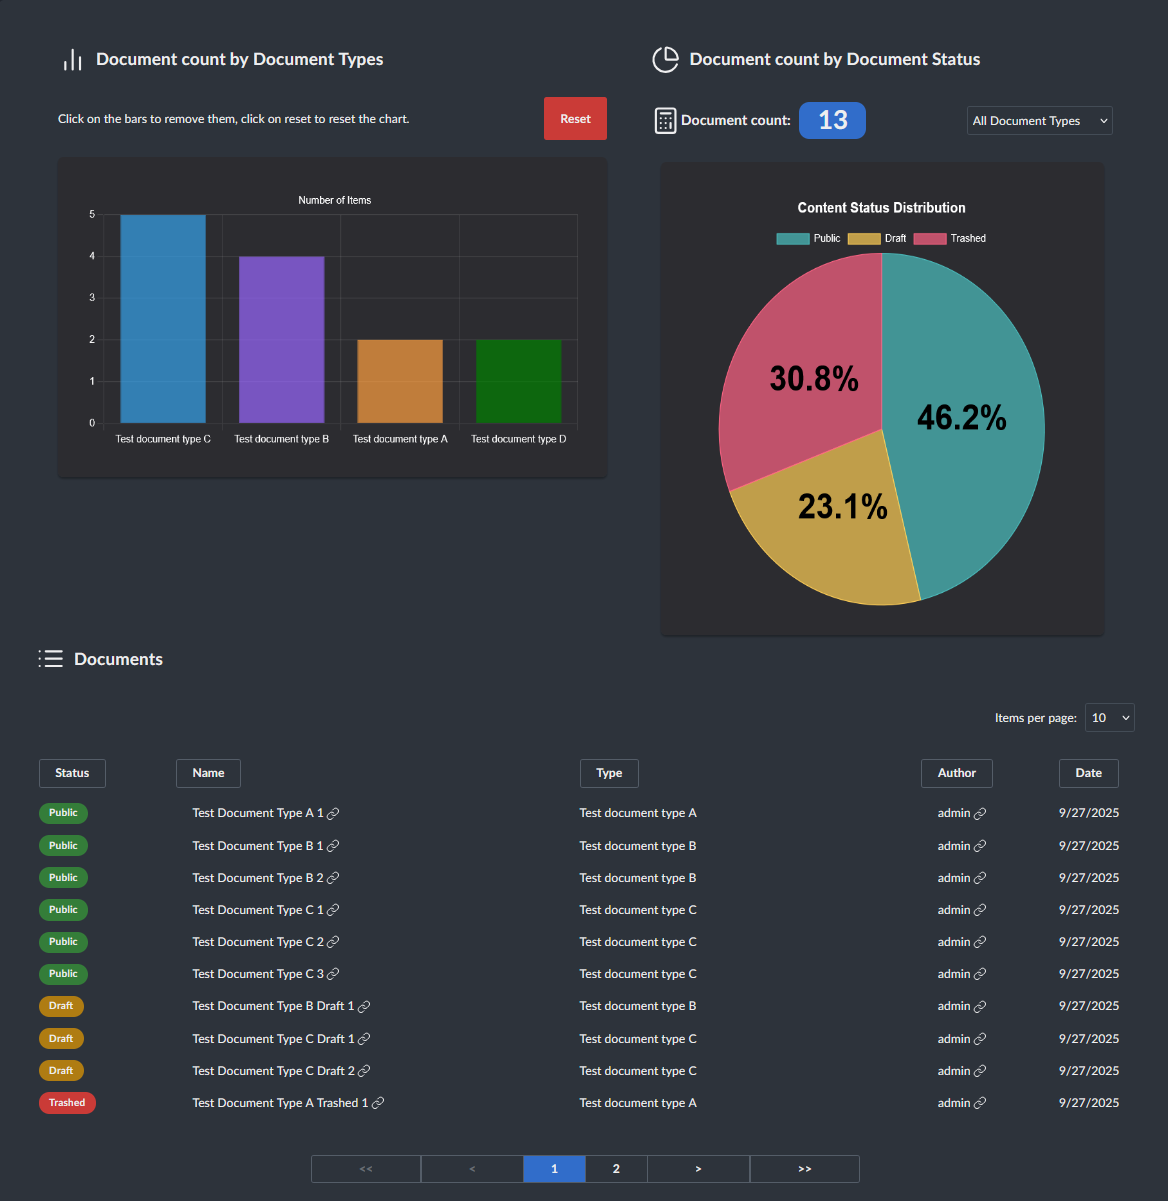
This dashboard consists of three parts:
- Document count by Document Types: Bar chart representation of the document counts by doucment types. You can hide different types by clicking on them, and reveal all by clicking on "Reset".
- Document count by Document Status: Pie chart representation of the document counts by document statuses. By default all document types are taken into account, but you can filter them with the dropdown.
- Documents: A table that lists all the documents and their details like: status, name, type, author and date. The table is being filtered by document types by the dropdown above the pie chart. You can order them by each column, by clicking on the column name. Clicking on the name brings you to the edit page of the document. Clicking on the author brings you to the edit page of the user.
This dashboard consists of two parts:
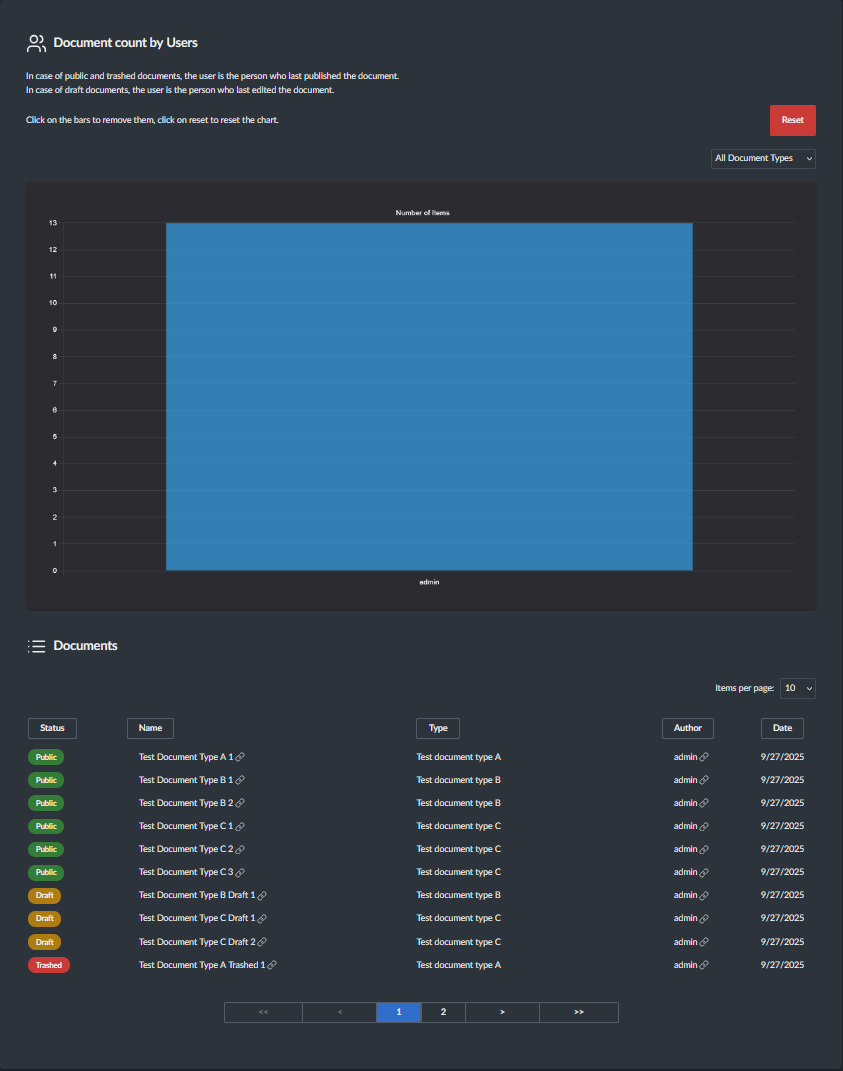
- Document count by Users: Bar chart representation of the document counts by users.
You can hide different users by clicking on them, and reveal all by clicking on "Reset".
By default all document types are taken into account, but you can filter them with the dropdown.
Only users with at least one of the following permissions are listed:
- Umb.Document.Create
- Umb.Document.Update
- Umb.Document.Publish
- Documents: A table that lists all the documents and their details like: status, name, type, author and date. The table is being filtered by document types by the dropdown above the bar chart. You can order them by each column, by clicking on the column name. Clicking on the name brings you to the edit page of the document. Clicking on the author brings you to the edit page of the user.
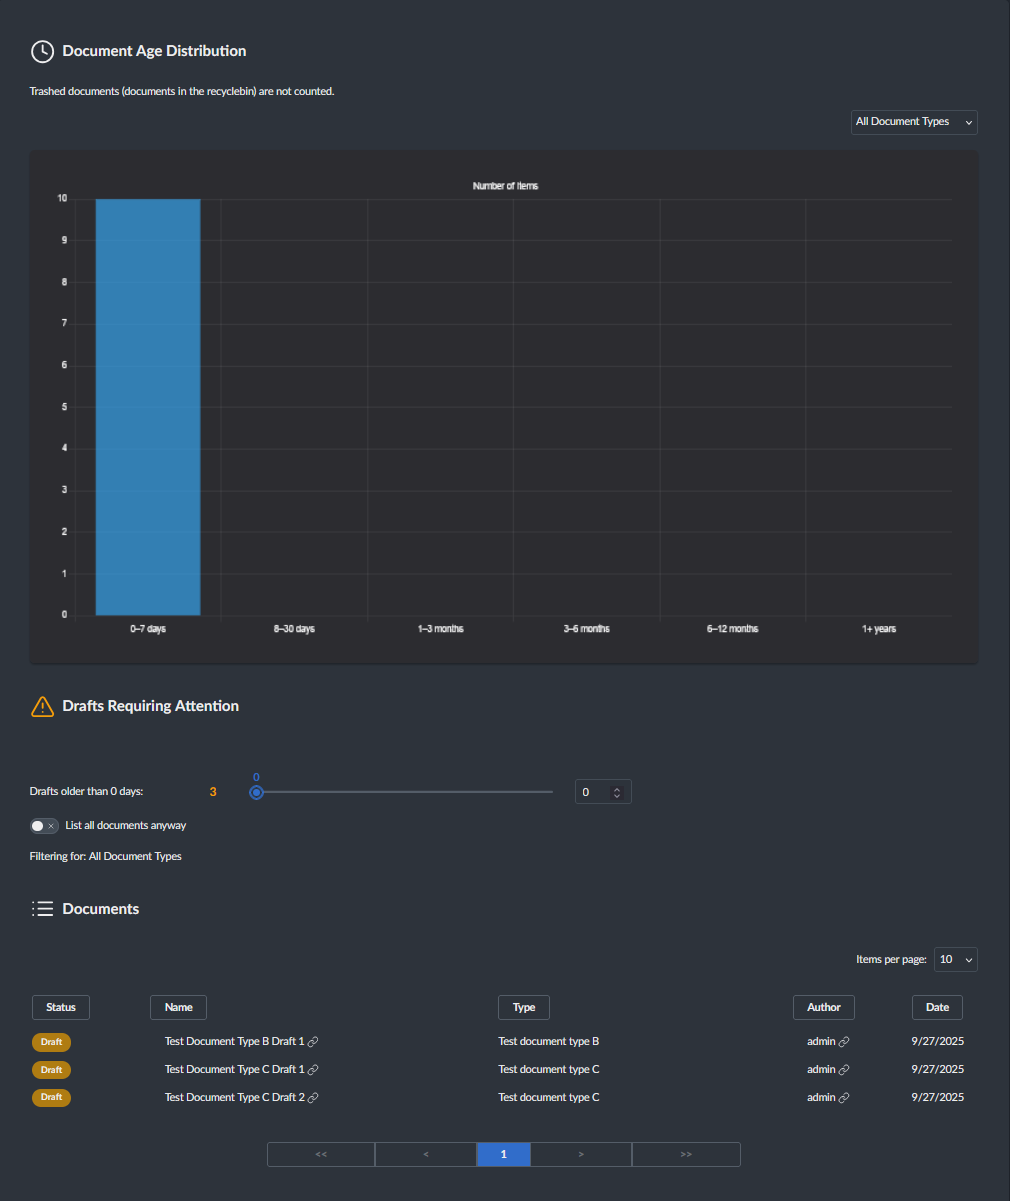
This dashboard consists of three parts:
- Document Age Distribution: Bar chart representation of the document counts by age. By default all document types are taken into account, but you can filter them with the dropdown.
- Drafts Requiring Attention: By using the slider you can filter for documents with different ages. By default only documents with the draft status (not trashed, not published) are counted. You can override this wit the toggle. This part is only displaying a count, but the documents will be listed in the documents table. By default all document types are taken into account, but you can filter them with the dropdown above the bar chart.
- Documents: A table that lists all the documents and their details like: status, name, type, author and date. The table is being filtered by document types by the dropdown above the bar chart. The table is also being filtered for the documents with draft statuses only. You can override this with the toggle. The table is also being filtered by the documents age slider. This way the user can find the specific documents in the table. You can order them by each column, by clicking on the column name. Clicking on the name brings you to the edit page of the document. Clicking on the author brings you to the edit page of the user.
Example content is only available if you clone the whole repository and run the SBD.ContentInsights.TestSite web project.
Since the project is not using the paid version of uSync, only one user is created, the default admin user. But if you want to test something you can add users, and create documents with those users.
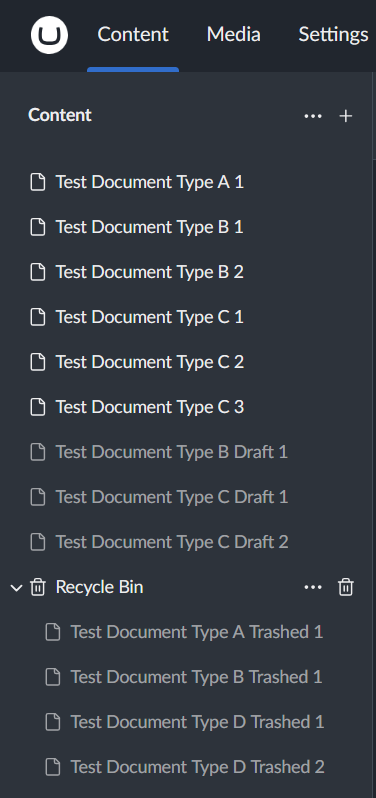
There are four documents types:
- Test document type A
- Public: 1
- Draft: 0
- Trashed: 1
- Test document type B
- Public: 2
- Draft: 1
- Trashed: 1
- Test document type C
- Public: 3
- Draft: 2
- Trashed: 0
- Test document type D
- Public: 0
- Draft: 0
- Trashed: 2
If you update the TypeScript files, you need to re-generate the scripts. Simply run:
npm run build
If you contribute and modify the C# controller, then you also need to reflect the changes in TypeScript.
To do this, simply from the SBD.ContentInsights\src\SBD.ContentInsights\client folder use:
curl -k https://localhost:44387/umbraco/swagger/content-insights/swagger.json -o swagger.json
then run:
npm run generate
while the site is running.
- uSync: For creating the example documents on the test site.
- Chart.js: For displaying data in charts.
- .NET-Analyzers: For static code analysis.
This project is licensed under the MIT License.
Third-party libraries are provided under their own licenses. See Docs/Third-party notices for details.
If you want to support me and my work, consider sponsoring me on GitHub. :)
All support is appreciated!
If you would like to work with me, feel free to contact me via email.
My business email address is available in my GitHub bio.