This Helm chart provisions the Opstree Redis Dashboard (Grafana ID 16056) as a ConfigMap. It's automatically imported into Grafana via the sidecar in the kube-prometheus-stack Helm chart, saving you from manual uploads.
View the full dashboard details and screenshots on Grafana.com.
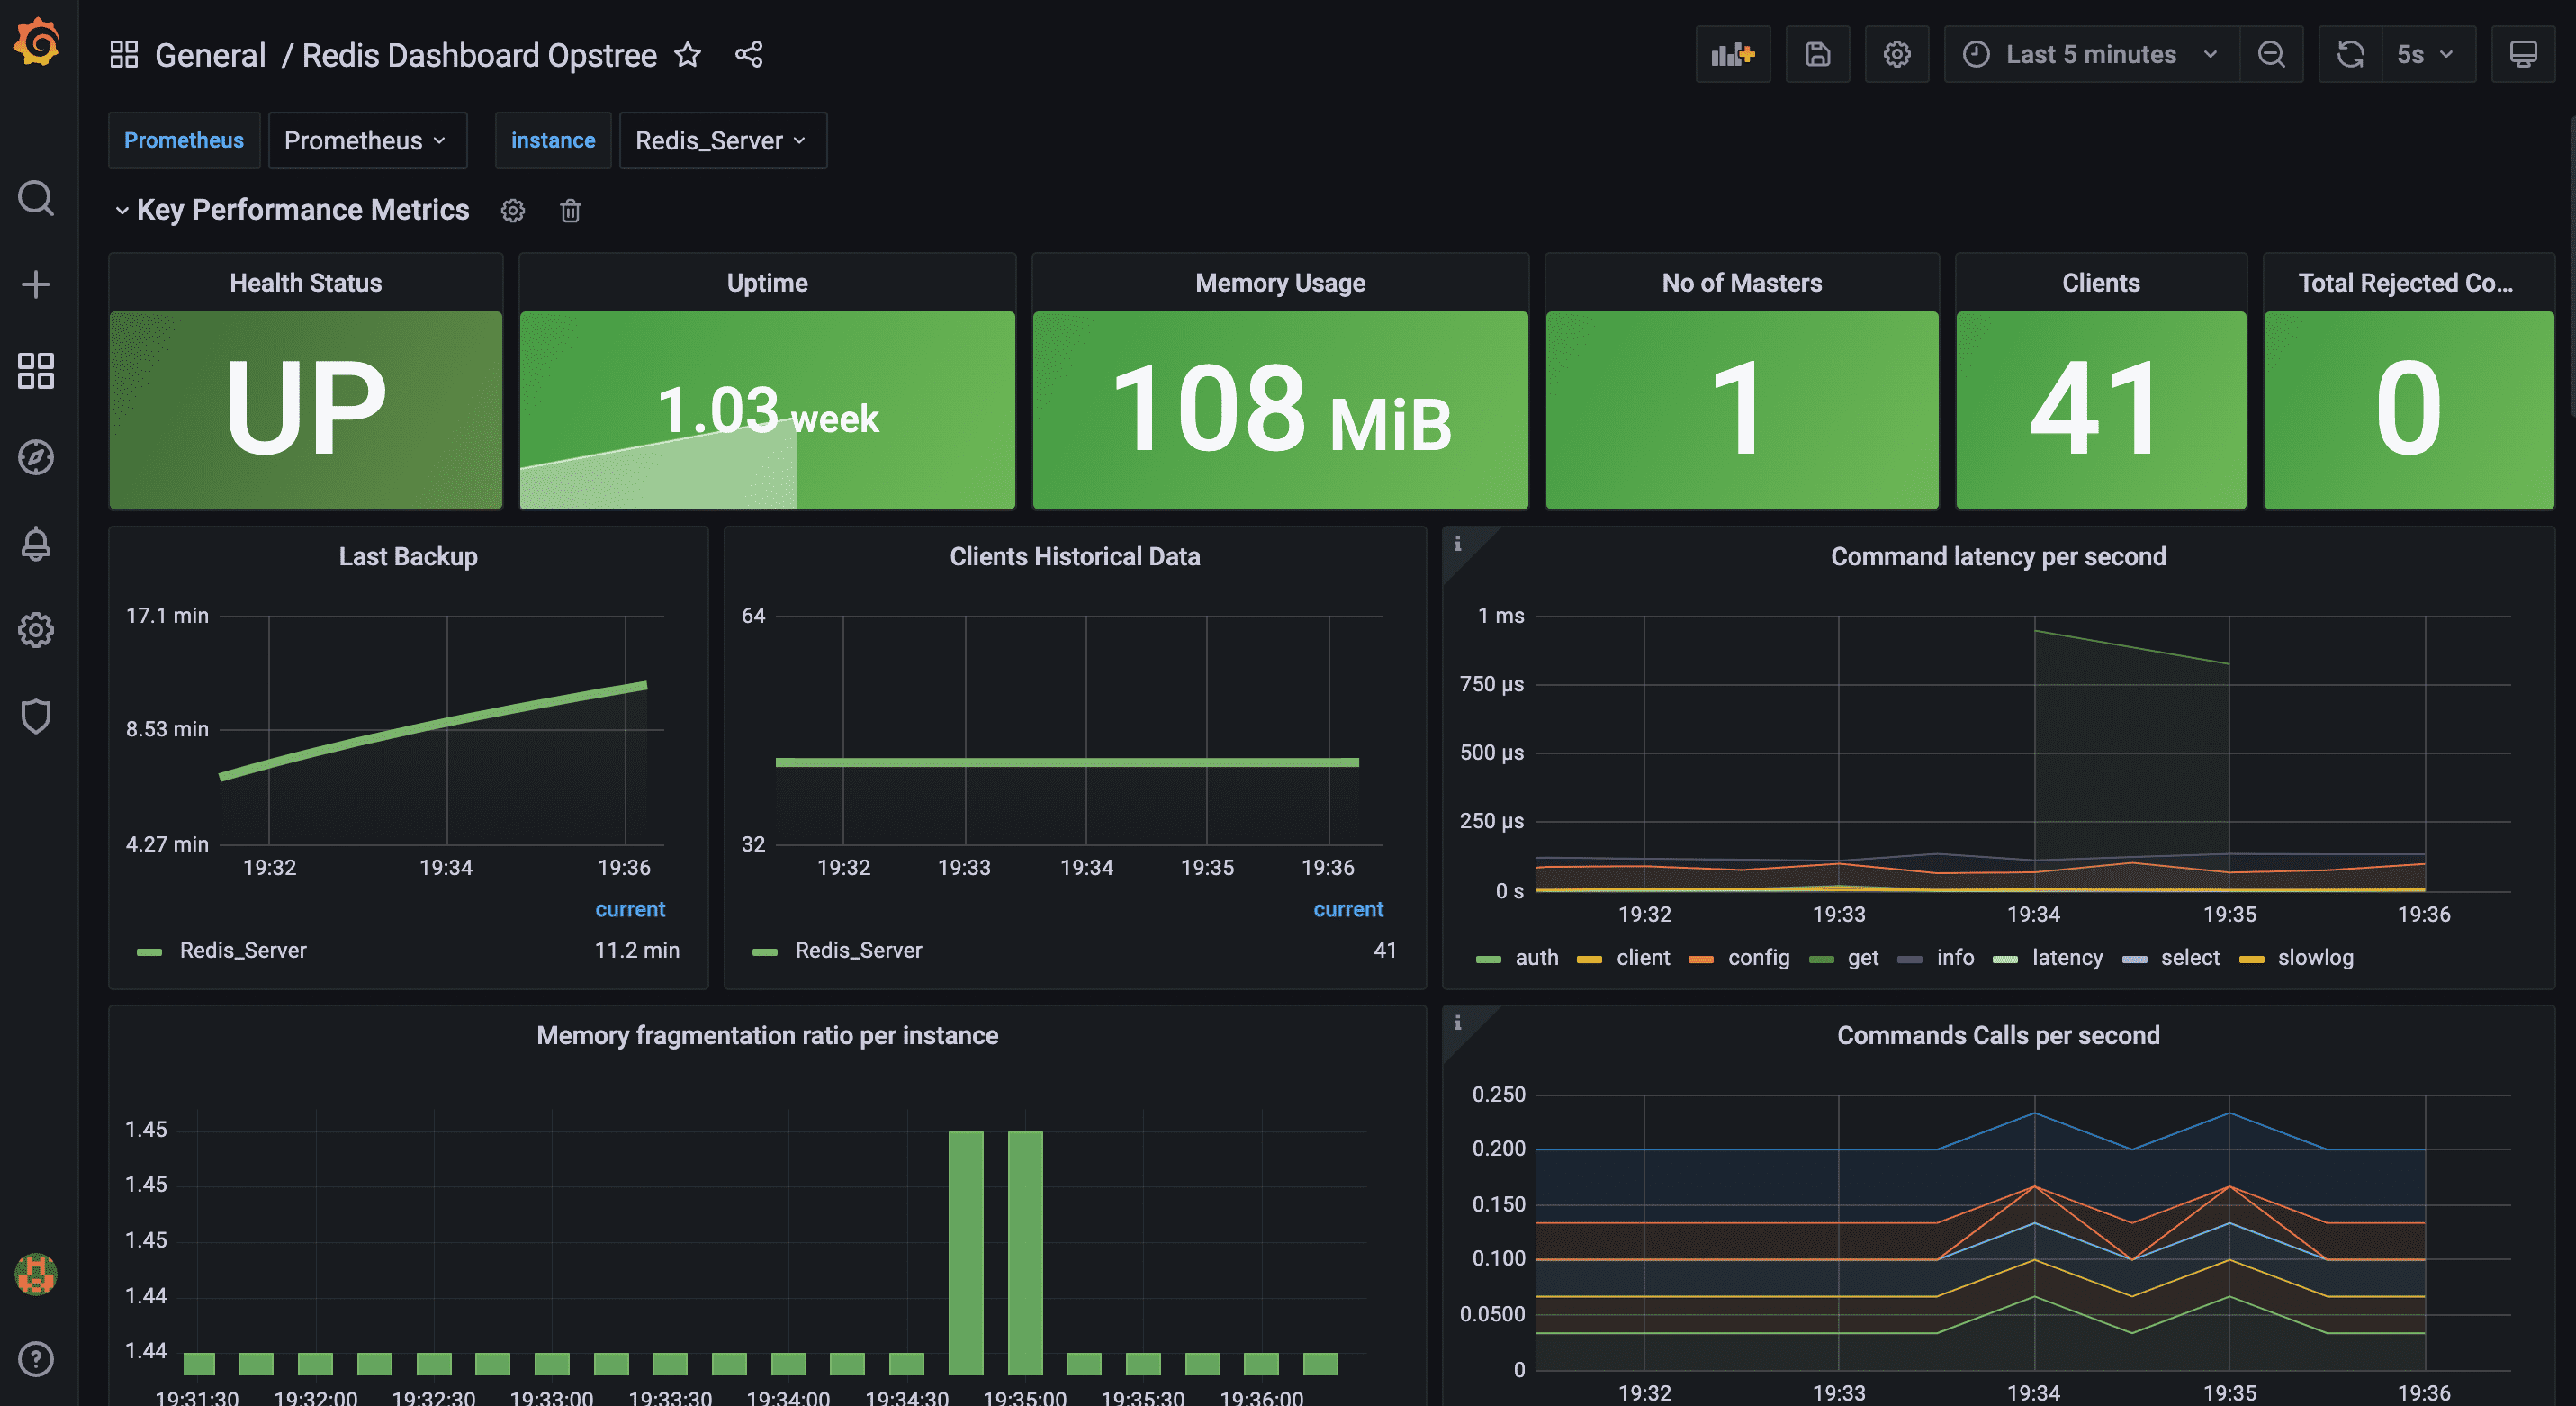
I created this for my Kubernetes monitoring stack with Redis. It automates dashboard setup—no Grafana UI fiddling. The dashboard visualizes metrics from the Prometheus redis_exporter, including connections, memory, commands, and more. Feedback welcome on GitHub!
- kube-prometheus-stack installed with the Grafana sidecar enabled (it's on by default).
- Redis instance(s) with redis_exporter enabled and metrics scraped by Prometheus (e.g., via a ServiceMonitor).
- Prometheus as your Grafana datasource (customizable via chart values).
Compatibility Note: This dashboard works with any Redis setup using redis_exporter—not just Opstree's. Examples include Bitnami Redis or custom deployments. If using the Opstree Redis Operator (ot-helm), enable redisExporter.enabled: true in your values.
Install via OCI (no local clone needed):
helm install redis-dashboard oci://ghcr.io/emrin/charts/redis-grafana-dashboard --version 0.1.0 -n monitoringOr add as a release in helmfile.yaml:
releases:
  - name: redis-grafana-dashboard
    namespace: monitoring
    chart: oci://ghcr.io/emrin/charts/redis-grafana-dashboard
    version: 0.1.0
    needs:
      - monitoring/kube-prometheus-stack
wait: trueOverride values during install (e.g., helm install ... --set datasource="MyProm"):
namespace: Where to create the ConfigMap (default:monitoring).label: Sidecar detection label (default:grafana_dashboard).folder: Grafana folder for the dashboard (optional annotation).datasource: Replace the default datasource in the JSON (e.g., if not "Prometheus").
Full defaults in values.yaml.
The dashboard needs Redis metrics scraped. Here's an example ServiceMonitor for the Opstree Redis Operator (adapt for your setup):
apiVersion: monitoring.coreos.com/v1
kind: ServiceMonitor
metadata:
  name: my-redis-monitor
  labels:
    release: kube-prometheus-stack  # Prometheus selector
spec:
  selector:
    matchLabels:
      redis_setup_type: cluster  # From ot-helm/redis-cluster
  endpoints:
    - port: redis-exporter  # Exporter port
      path: /metrics
      interval: 30s
      scrapeTimeout: 10s
  namespaceSelector:
    matchNames:
      - ot-operators  # Redis namespace
After applying, verify in Prometheus targets that /metrics is scraped.
If Opstree updates the dashboard on Grafana.com, feel free to submit a Pull Request (PR) with the new JSON file (replace ./dashboards/redis-dashboard.json), an updated chart version, and any necessary tweaks. Contributions are welcome!
MIT (see LICENSE).