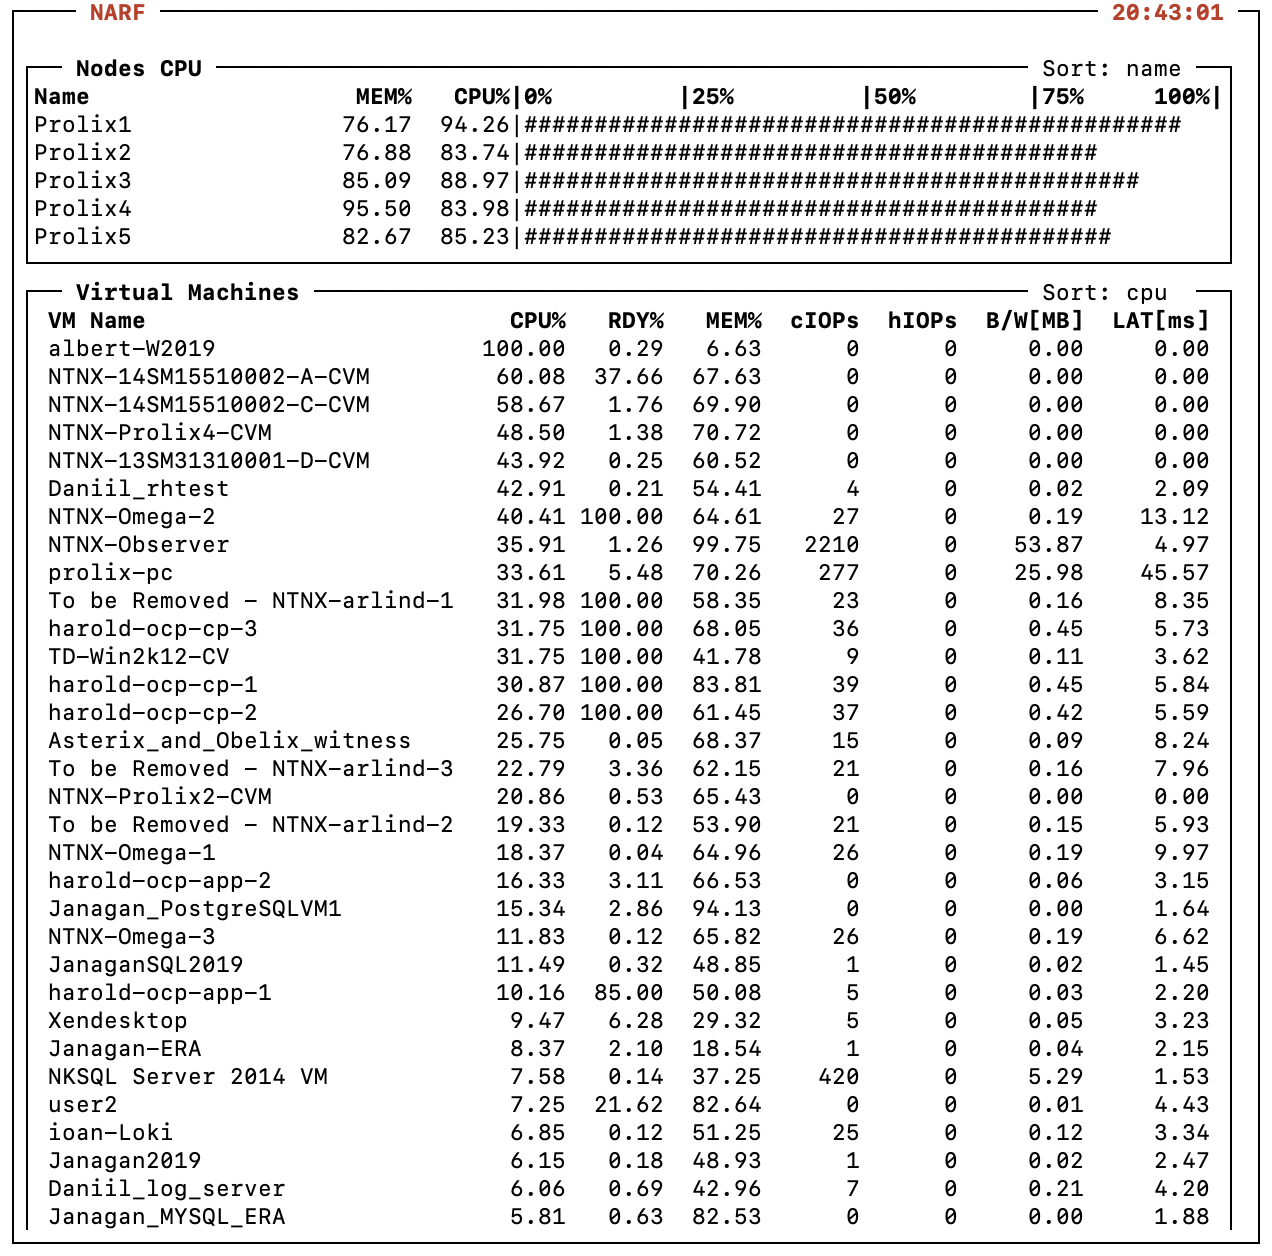
NARF stands for Nutanix Activity Report Facilitator.
Inspired in old school UNIX commands like sar, iostat and top, aim to be a simple tool to query and report information from Nutanix clusters performance datasource (arithmos DB at the moment). With a feature to export the data into line protocol files that can be uploaded and visualized into a graphical tool like Grafana.
nutanix@CVM:~/tmp$ ./narf.py -h
usage: narf.py [-h] [--nodes] [--node-name NODE_NAME] [--uvms]
[--volume-groups] [--sort {name,cpu,rdy,mem,iops,bw,lat}]
[--report-type {iops,bw,lat}] [-start-time START_TIME]
[-end-time END_TIME] [--export] [--test]
[sec] [count]
Report cluster activity
positional arguments:
sec Interval in seconds
count Number of iterations
optional arguments:
-h, --help show this help message and exit
--nodes, -n Nodes activity report
--node-name NODE_NAME, -N NODE_NAME
Filter VMs by node name
--uvms, -v VMs activity report
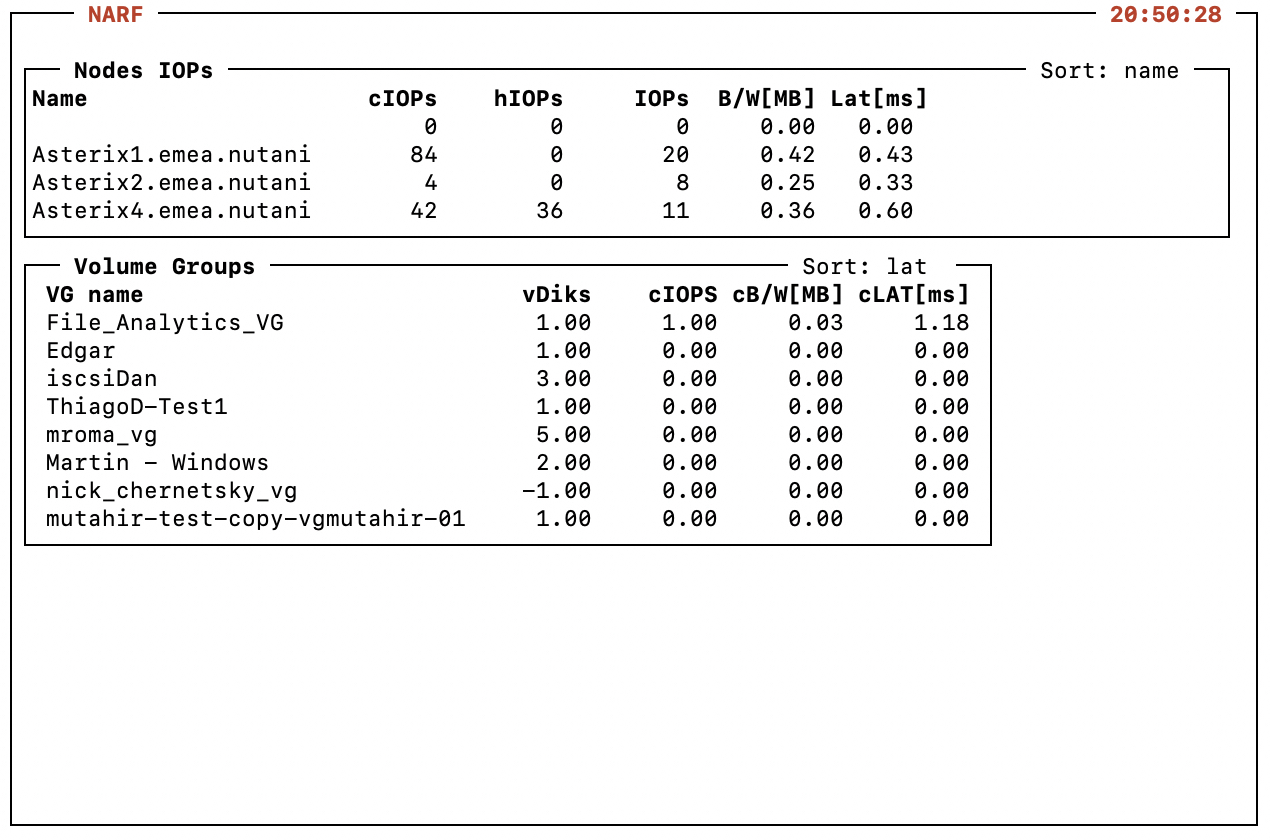
--volume-groups, -g Volume Groups activity report
--sort {name,cpu,rdy,mem,iops,bw,lat}, -s {name,cpu,rdy,mem,iops,bw,lat}
Sort output
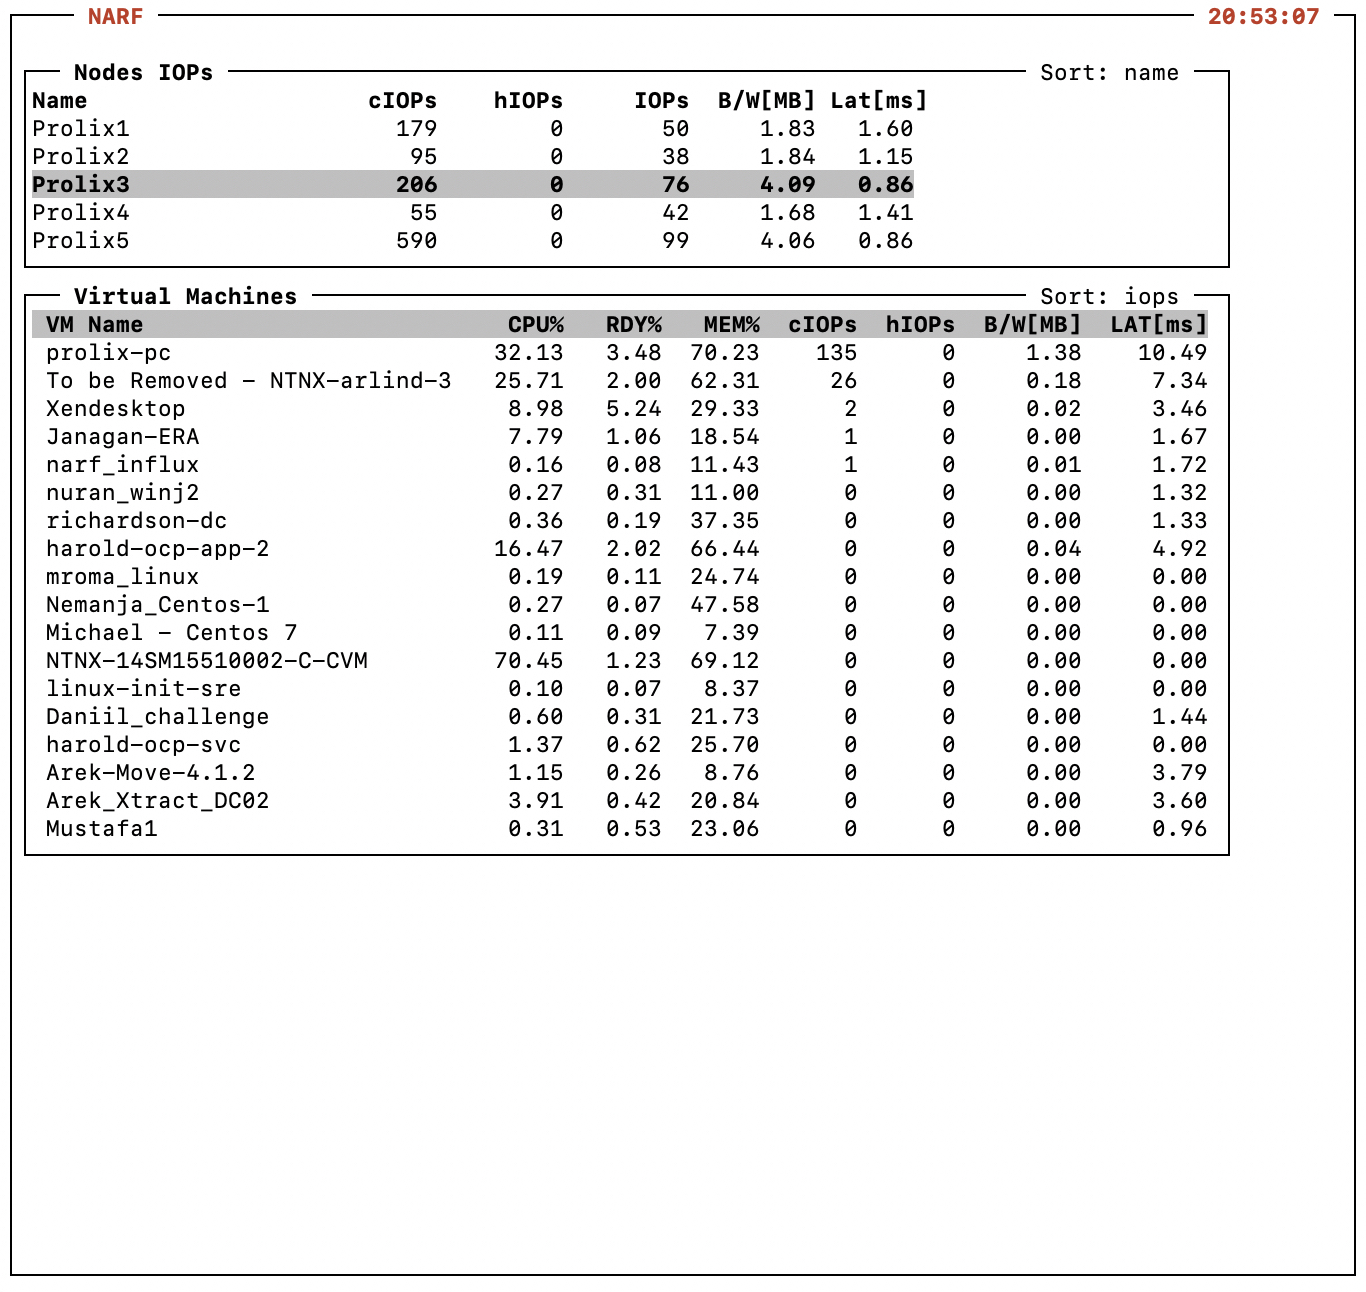
--report-type {iops,bw,lat}, -t {iops,bw,lat}
Report type
-start-time START_TIME, -S START_TIME
Start time in format YYYY/MM/DD-hh:mm:ss. Specified in
local time.
-end-time END_TIME, -E END_TIME
End time in format YYYY/MM/DD-hh:mm:ss. Specified in
local time
--export, -e Export data to files in line protocol
--test Place holder for testing new features
"When you eliminate the impossible, whatever remains, however improbable, must
be the truth." Spock.
nutanix@CVM:~/tmp$ ./narf.py -n 2 2
2022/02/02-23:29:21 | Node                   CPU%   MEM%    hIOPS    cIOPS     IOPS  B/W[MB]  LAT[ms]
2022/02/02-23:29:21 | Prolix1               88.30  76.09     0.00   165.00    40.00     1.93     0.55
2022/02/02-23:29:21 | Prolix2               73.02  81.54     0.00   247.00    31.00     1.69     0.54
2022/02/02-23:29:21 | Prolix3               86.36  85.11     0.00   504.00    88.00     5.20     0.49
2022/02/02-23:29:21 | Prolix4               68.48  95.50     0.00    35.00    33.00     1.21     0.56
2022/02/02-23:29:21 | Prolix5               60.34  81.86     0.00    76.00    89.00     5.37     0.30

2022/02/02-23:29:23 | Node                   CPU%   MEM%    hIOPS    cIOPS     IOPS  B/W[MB]  LAT[ms]
2022/02/02-23:29:23 | Prolix1               88.30  76.09     0.00   168.00    38.00     1.66     0.81
2022/02/02-23:29:23 | Prolix2               73.02  81.54     0.00   178.00    30.00     1.45     0.60
2022/02/02-23:29:23 | Prolix3               86.36  85.11     0.00   504.00    88.00     5.20     0.49
2022/02/02-23:29:23 | Prolix4               68.48  95.50     0.00    35.00    33.00     1.21     0.56
2022/02/02-23:29:23 | Prolix5               60.34  81.86     0.00    90.00    90.00     5.18     0.27
nutanix@CVM:~/tmp$ ./narf.py -vN Prolix1 -s rdy
2022/02/02-23:31:26 | Node                   CPU%   RDY%   MEM%    hIOPS    cIOPS cB/W[MB] cLAT[ms]
2022/02/02-23:31:26 | harold-ocp-cp-1       31.26  46.64  86.04     0.00    41.00     0.62     2.94
2022/02/02-23:31:26 | harold-ocp-cp-3       26.48  44.88  66.25     0.00    39.00     0.60     3.81
2022/02/02-23:31:26 | harold-ocp-cp-2       15.96  44.40  58.27     0.00    46.00     0.67     5.56
2022/02/02-23:31:26 | TD-Win2k12-CV          4.37  25.13  39.50     0.00     7.00     0.07     2.21
2022/02/02-23:31:26 | NTNX-Omega-2          29.78  24.08  64.26     0.00    24.00     0.18     5.73
2022/02/02-23:31:26 | harold-ocp-app-1       7.43  20.51  45.81     0.00     7.00     0.04     2.30
2022/02/02-23:31:26 | To be Removed - NTNX  22.90  20.47  57.87     0.00    71.00     0.96     3.17
2022/02/02-23:31:26 | user2                  6.16   9.46  80.84     0.00     0.00     0.01     2.48
2022/02/02-23:31:26 | NTNX-14SM15510002-A-  54.70   7.23  67.92     0.00     0.00     0.00     0.00
2022/02/02-23:31:26 | Anas-Citrix-ddc2       4.59   6.33  53.02     0.00     4.00     0.08     2.31
2022/02/02-23:31:26 | ioan-WinAdminCenter-   2.39   6.26  55.22     0.00     1.00     0.01     2.09
2022/02/02-23:31:26 | harold-ocp-bootstrap   1.77   5.26  20.79     0.00     2.00     0.01     1.93
2022/02/02-23:31:26 | user3                  1.38   5.05  89.53     0.00     0.00     0.00     2.06
2022/02/02-23:31:26 | tar-c8-1               0.99   3.71  39.79     0.00     0.00     0.00     5.41
2022/02/02-23:31:26 | M-vLAB-AD02            0.52   3.55  -1.00     0.00     0.00     0.00     2.18
2022/02/02-23:31:26 | Kirill-CentOS8         1.34   2.29  39.81     0.00     1.00     0.01     5.08
2022/02/02-23:31:26 | ioan-alpine-HAProxy    0.80   1.78  10.18     0.00     0.00     0.00     1.78
2022/02/02-23:31:26 | Pavel.CentOS7          0.21   1.11  11.04     0.00     0.00     0.00     0.00
nutanix@CVM:~/tmp$ ./narf.py -ns lat -S 2022/01/01-09:00:00 -E 2022/01/01-12:00:00 3600
2022/01/01-09:00:00 | Node                   CPU%   MEM%    hIOPS    cIOPS     IOPS  B/W[MB]  LAT[ms]
2022/01/01-09:00:00 | Prolix3               95.13  73.91    -1.00   173.26    41.22     2.04     1.40
2022/01/01-09:00:00 | Prolix4               75.71  96.21    -1.00  1213.31    51.37     2.08     1.27
2022/01/01-09:00:00 | Prolix2               72.12  70.75    -1.00    46.14    36.45     1.49     1.16
2022/01/01-09:00:00 | Prolix1               86.39  61.39    -1.00   168.86    45.79     1.91     1.06
2022/01/01-09:00:00 | Prolix5               73.74  88.97    -1.00   646.31   197.26     6.06     0.66

2022/01/01-10:00:00 | Node                   CPU%   MEM%    hIOPS    cIOPS     IOPS  B/W[MB]  LAT[ms]
2022/01/01-10:00:00 | Prolix4               76.45  96.21    -1.00  1331.34    52.57     2.02     1.25
2022/01/01-10:00:00 | Prolix2               71.26  70.76    -1.00    45.54    33.26     1.37     1.13
2022/01/01-10:00:00 | Prolix3               95.36  73.91    -1.00   186.78    65.73     2.40     1.05
2022/01/01-10:00:00 | Prolix1               86.20  61.40    -1.00   168.97    44.67     1.73     0.97
2022/01/01-10:00:00 | Prolix5               73.43  88.98    -1.00   684.89   151.79     4.97     0.63

2022/01/01-11:00:00 | Node                   CPU%   MEM%    hIOPS    cIOPS     IOPS  B/W[MB]  LAT[ms]
2022/01/01-11:00:00 | Prolix4               77.58  96.22    -1.00  1419.55    41.05     1.60     1.34
2022/01/01-11:00:00 | Prolix3               95.39  73.92    -1.00   192.05    56.88     2.15     1.27
2022/01/01-11:00:00 | Prolix2               72.27  70.77    -1.00    47.08    36.60     1.37     1.14
2022/01/01-11:00:00 | Prolix1               86.06  61.41    -1.00   174.47    48.55     1.82     1.01
2022/01/01-11:00:00 | Prolix5               74.20  88.98    -1.00   646.07   181.97     5.22     0.68
nutanix@CVM:~/tmp$ ./narf.py -vs mem -N prolix1 -S 2022/01/01-09:00:00 -E 2022/01/01-11:00:00 3600
2022/01/01-09:00:00 | Node                   CPU%   RDY%   MEM%    hIOPS    cIOPS cB/W[MB] cLAT[ms]
2022/01/01-09:00:00 | NTNX-14SM15510002-A-  62.19   2.57  69.53    -1.00    -1.00    -1.00    -1.00
2022/01/01-09:00:00 | harold-ocp-cp-1       23.88  14.58  56.30    -1.00    35.40     0.49     2.62
2022/01/01-09:00:00 | harold-ocp-cp-2       24.14  15.06  55.81    -1.00    34.08     0.38     2.52
2022/01/01-09:00:00 | NTNX-Omega-2          30.86   4.96  55.00    -1.00    29.78     0.22     3.49
2022/01/01-09:00:00 | Anas-Citrix-ddc2       5.49   3.64  53.61    -1.00     7.11     0.14     1.98
2022/01/01-09:00:00 | harold-ocp-cp-3       23.68  14.91  53.43    -1.00    34.94     0.42     2.54
2022/01/01-09:00:00 | ioan-WinAdminCenter-   2.71   1.27  42.24    -1.00     2.22     0.03     1.86
2022/01/01-09:00:00 | TD-Win2k12-CV         85.94  16.47  39.34    -1.00     6.47     0.08     2.20
2022/01/01-09:00:00 | Kirill-CentOS8         0.03   0.27  27.40    -1.00    -1.00     0.00     8.96
2022/01/01-09:00:00 | tar-c8-1               0.07   0.07  18.48    -1.00    -1.00    -1.00    -1.00
2022/01/01-09:00:00 | harold-ocp-bootstrap   1.68   1.67  17.95    -1.00     3.56     0.02     2.02
2022/01/01-09:00:00 | harold-ocp-app-1       1.17   1.35  10.62    -1.00    14.88     0.08     1.86
2022/01/01-09:00:00 | ioan-alpine-HAProxy    0.77   0.23  10.16    -1.00    -1.00     0.00     1.70
2022/01/01-09:00:00 | Pavel.CentOS7          0.21   0.21  10.04    -1.00    -1.00     0.00     8.15
2022/01/01-09:00:00 | user3                 -1.00  -1.00  -1.00    -1.00    -1.00    -1.00    -1.00
2022/01/01-09:00:00 | user2                 -1.00  -1.00  -1.00    -1.00    -1.00    -1.00    -1.00
2022/01/01-09:00:00 | To be Removed - NTNX  -1.00  -1.00  -1.00    -1.00    -1.00    -1.00    -1.00
2022/01/01-09:00:00 | M-vLAB-AD02           -1.00  -1.00  -1.00    -1.00    -1.00    -1.00    -1.00

2022/01/01-10:00:00 | Node                   CPU%   RDY%   MEM%    hIOPS    cIOPS cB/W[MB] cLAT[ms]
2022/01/01-10:00:00 | NTNX-14SM15510002-A-  62.35   2.55  69.72    -1.00    -1.00    -1.00    -1.00
2022/01/01-10:00:00 | harold-ocp-cp-1       23.99  14.53  58.11    -1.00    35.39     0.47     2.76
2022/01/01-10:00:00 | harold-ocp-cp-2       24.14  14.98  57.35    -1.00    34.05     0.38     2.43
2022/01/01-10:00:00 | harold-ocp-cp-3       23.18  14.73  55.29    -1.00    34.67     0.42     2.60
2022/01/01-10:00:00 | NTNX-Omega-2          30.88   4.95  55.08    -1.00    30.14     0.29     3.59
2022/01/01-10:00:00 | Anas-Citrix-ddc2       5.45   3.65  53.74    -1.00     6.49     0.13     1.99
2022/01/01-10:00:00 | ioan-WinAdminCenter-   2.54   1.28  42.24    -1.00     2.17     0.02     1.88
2022/01/01-10:00:00 | TD-Win2k12-CV         86.54  13.97  39.56    -1.00    15.08     1.13     3.06
2022/01/01-10:00:00 | Kirill-CentOS8         0.11   0.25  27.38    -1.00    -1.00     0.00     7.58
2022/01/01-10:00:00 | tar-c8-1               0.07   0.08  18.48    -1.00    -1.00    -1.00    -1.00
2022/01/01-10:00:00 | harold-ocp-bootstrap   1.68   1.68  17.93    -1.00     3.67     0.02     1.95
2022/01/01-10:00:00 | harold-ocp-app-1       1.10   1.34  10.62    -1.00    15.71     0.08     1.90
2022/01/01-10:00:00 | ioan-alpine-HAProxy    0.77   0.22  10.14    -1.00    -1.00     0.00     1.95
2022/01/01-10:00:00 | Pavel.CentOS7          0.16   0.21  10.04    -1.00    -1.00     0.00     7.03
2022/01/01-10:00:00 | user3                 -1.00  -1.00  -1.00    -1.00    -1.00    -1.00    -1.00
2022/01/01-10:00:00 | user2                 -1.00  -1.00  -1.00    -1.00    -1.00    -1.00    -1.00
2022/01/01-10:00:00 | To be Removed - NTNX  -1.00  -1.00  -1.00    -1.00    -1.00    -1.00    -1.00
2022/01/01-10:00:00 | M-vLAB-AD02           -1.00  -1.00  -1.00    -1.00    -1.00    -1.00    -1.00
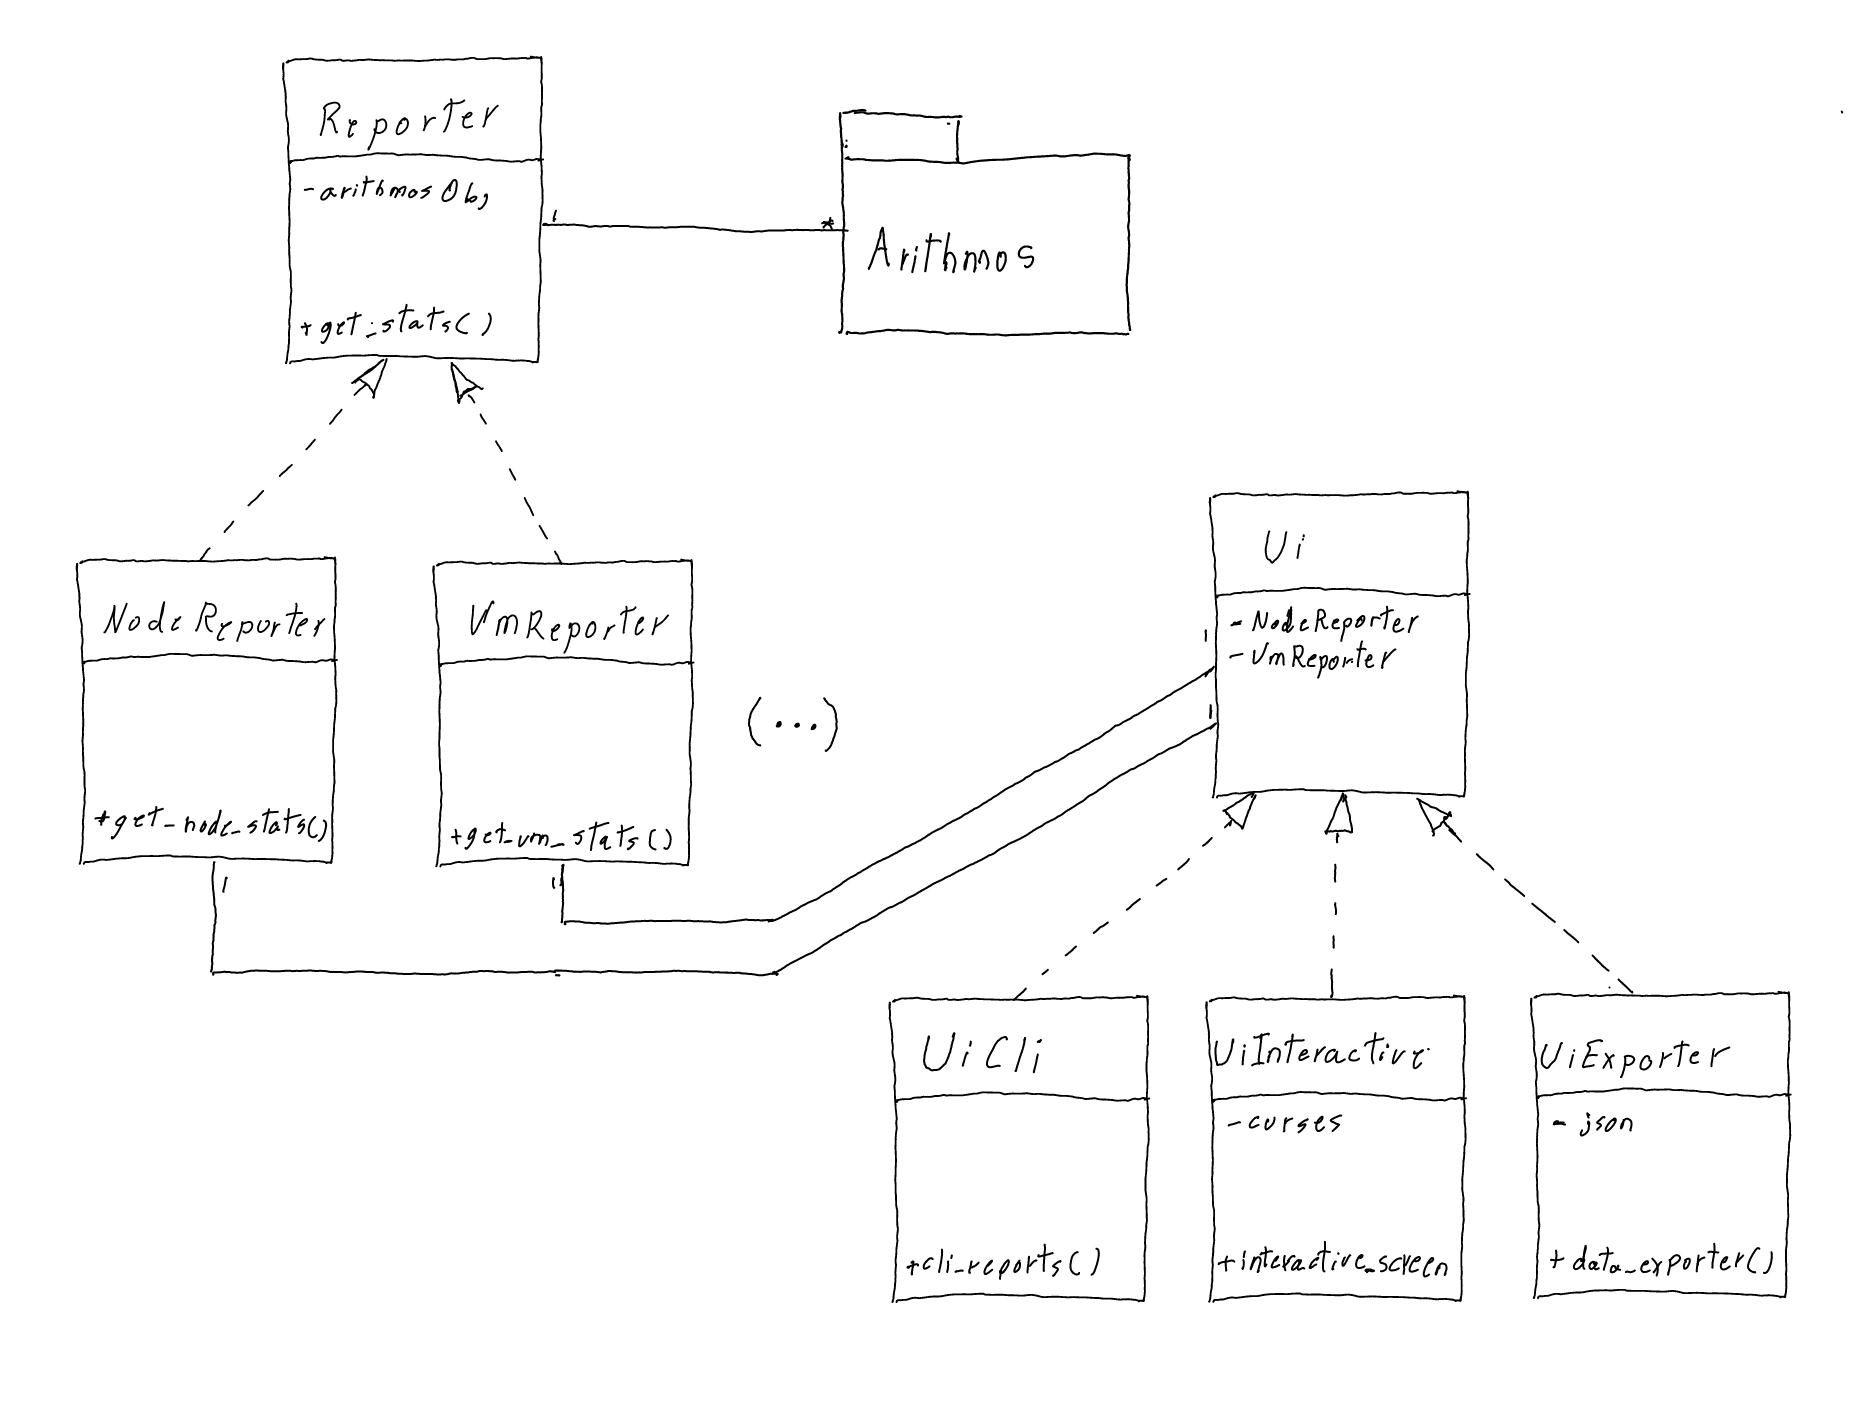
Reporter classes abstract the datasource from the UI classes. Reporter classes are in charge of collect stats from the cluster datasource (Arithmos) and pass the information to UI classes in form of simple native data structures (Python arrays and dictionaries). In this way, if the datasource is changed later (for example from Arithmos to IDF) there will be no need to modify the Ui classes, it will only be needed to change the Reporter classes.
The Ui super class will hold the attributes that links to all reporters but will not implement any method for presenting information (it's an interface), this assume every UI subclass will need every reporter. Ui subclasses will implement neccesary methods to display information accordingly making use of reporters defined in the super class.
As for the Reporter classes the relationship between super and sub classes and the methods they need to implement is slightly more complicated because the way data is returned from Arithmos. Wherever possible one should prefer to implement a method in the superclass; breakdown a method so that the generic part of the code is moved to the super class while leaving the specifics to entity reporter is a valid resource, as seen in the method _get_live_stats() in super class Reporter which is used by _get_node_live_stats() in the NodeReporter and _get_vm_live_stats() in the VmReporter sub classes (This is aligned with the principles of avoiding code duplication and procuring easy maintenance). More reporters will be needed as more reports for different entities are added, e.g VdiskReporter.
For the exporter feature NARF create line protocol files that can be imported to InfluxDB. Each entity type has an schema. All schemas have the following tags to be able to differentiate the collection and cluster where they come from: exportId, clusterId and clusterName, this means all datapoints for all schemas in a collection will have the same value for these three tags. Another two common tags entityId and entityName enable the unequivocal identification of each entity, all datapoints for a given entity will have the same values for these tags. It is through the measurement name that entity type can be identified.
A datapoint looks like this:
   node,exportId=0,clusterId=20986,clusterName=Prolix,entityId=1234,entityName=Prolix1 hypervisorCpuUsagePercent=85.88 ... 1641405558000000000
   ---- --------------------------------------------- -------------------------------- -------------------------------->   -------------------
    |                       |                                          |                               |                            |
Measurement     Collection and cluster tags                       Entity tags                     Field keys                    Timestamp
This schema has been defined following best practices documented here:
https://docs.influxdata.com/influxdb/v2.1/write-data/best-practices/schema-design/
Schema definition:
- Measurement: node
- Tag key: exportId
- Tag key: clusterId
- Tag key: clusterName
- Tag key: entityId
- Tag key: entityName
- Field key: hypervisorCpuUsagePercent
- Field key: hypervisorMemoryUsagePercent
- Field key: controllerNumIops
- Field key: hypervisorNumIops
- Field key: numIops
- Field key: ioBandwidthMBps
- Field key: avgIoLatencyMsecs
Example
This sample:
                      Node                   CPU%   MEM%    cIOPs    hIOPs     IOPs  B/W[MB]  LAT[ms]
2022/01/05-10:00:00   Prolix1               85.88  59.91   163.32    -1.00    62.00     3.01     1.01
2022/01/05-11:00:00   Prolix1               86.39  59.91   158.04    -1.00    70.00     2.95     1.10
2022/01/05-12:00:00   Prolix1               86.46  59.92   177.65    -1.00   160.00     5.08     1.14
Translate in this line protocol:
node,exportId=0,clusterId=20986,clusterName=Prolix,entityId=1234,entityName=Prolix1 hypervisorCpuUsagePercent=85.88,hypervisorMemoryUsagePercent=59.91,controllerNumIops=163.32,hypervisor_num_iops=-1.00,numIops=62.00,ioBandwidthMBps=3.01,avgIoLatencyMsecs=1.01 1641405558000000000
node,exportId=0,clusterId=20986,clusterName=Prolix,entityId=1234,entityName=Prolix1 hypervisorCpuUsagePercent=86.39,hypervisorMemoryUsagePercent=59.91,controllerNumIops=158.04,hypervisor_num_iops=-1.00,numIops=70.00,ioBandwidthMBps=2.95,avgIoLatencyMsecs=1.10 1641409164000000000
node,exportId=0,clusterId=20986,clusterName=Prolix,entityId=1234,entityName=Prolix1 hypervisorCpuUsagePercent=86.46,hypervisorMemoryUsagePercent=59.92,controllerNumIops=177.65,hypervisor_num_iops=-1.00,numIops=160.00,ioBandwidthMBps5.08,avgIoLatencyMsecs=1.14 1641412770000000000
Schema definition:
- Measurement: vm
- Tag key: clusterId
- Tag key: clusterName
- tag key: entityId
- Tag key: entityName
- Tag key: exportId
- Tag key: nodeName
- Field key: hypervisorCpuUsagePercent
- Field key: hypervisorCpuReadyTimePercent
- Field key: memoryUsagePercent
- Field key: controllerNumIops
- Field key: hypervisorNumIops
- Field key: numIops
- Field key: controllerIoBandwidthMBps
- Field key: controllerAvgIoLatencyMsecs
Example
This sample:
                      VM Name                          CPU%   RDY%   MEM%  cIOPs  hIOPs   IOPs  B/W[MB]  LAT[ms]
2022/01/03-09:00:00   harold-ocp-cp-1                 24.36  15.48  63.02     33     -1     -1     0.47     2.81
2022/01/03-10:00:00   harold-ocp-cp-1                 23.70  14.61  64.03     33     -1     -1     0.45     2.79
2022/01/03-11:00:00   harold-ocp-cp-1                 25.24  16.87  61.20     34     -1     -1     0.48     2.86
Translate in this line protocol:
vm,clusterId=20986,clusterName=Prolix,entityId=98765,entityName=harold-ocp-cp-1,exportId=0,nodeName=Prolix1 hypervisorCpuUsagePercent=24.36,hypervisorCpuReadyTimePercent=15.48,memoryUsagePercent=63.02,controllerNumIops=33,hypervisorNumIops=-1,numIops=-1,controllerIoBandwidthMBps=0.47,controllerAvgIoLatencyMsecs=2.81 1641405558000000000
vm,clusterId=20986,clusterName=Prolix,entityId=98765,entityName=harold-ocp-cp-1,exportId=0,nodeName=Prolix1 hypervisorCpuUsagePercent=23.70,hypervisorCpuReadyTimePercent=14.61,memoryUsagePercent=64.03,controllerNumIops=33,hypervisorNumIops=-1,numIops=-1,controllerIoBandwidthMBps=0.45,controllerAvgIoLatencyMsecs=2.79 1641409164000000000
vm,clusterId=20986,clusterName=Prolix,entityId=98765,entityName=harold-ocp-cp-1,exportId=0,nodeName=Prolix1 hypervisorCpuUsagePercent=25.24,hypervisorCpuReadyTimePercent=16.87,memoryUsagePercent=61.20,controllerNumIops=34,hypervisorNumIops=-1,numIops=-1,controllerIoBandwidthMBps=0.48,controllerAvgIoLatencyMsecs=2.86 1641412770000000000
- Provide easy access to cluster performance activity in any use case where access to the web interface via browser is not available.
- NARF allows to select a refresh rate specified in seconds from CLI (this will be added to interactive as well), this is timely way to look at cluster activity.
- For people familiarized with UNIX/Linux environments who prefer CLI than UI, NARF is a nice altenative to the web interface.
- For live reports it only displays running VMs. Assuming stopped VMs has no impact on cluster performance.
- Historic reports doesn't filter by running VMs, but it doesn't account for VM migrations. This is, at the moment for historic reports a VM is listed in the host where is currently running.
- Display a maximum of 252 VMs. This is the max number of entities that Arithmos query returns.
arithmos_cli provide quite some flexibility for different types of queries, while this is very powerfull, data is not presented in a human friendly way making it difficult to analyze, and command parameters tends to be complex and hard to remember for most day to day tasks. narf is not as comprehensive as arithmos, it just has a handfull of genral purpose reports with a small set of paramters to easy remembering, data is tabulated to make it easy to analyze, filter and transform piping to traditional UNIX/Linux commands.
Splitting tasks/features according to each interface, some taks intertwine between interfaces but it should be fine, I'm putting them where are more relevant.
- CLI interface - Eveything for inLine outputs
- Add name filtering in node report (-N argument)
- Interactive interface - top like interface
- VM specific report - implement a pad with VM cpu/rdy/mem/controller iops, etc, plus vDisks.
- Add capability to change refresh rate.
- Data exporter - Time range report, to be able to query historical data and export to files.
- Zort
- CLI interface - Eveything for inLine outputs
- Add read/write fields for lat,bw and iops. Maybe and extended report option?
- Interactive interface - top like interface
- Add the hability to filter VMs by hosts. With tab key.
- Data exporter - Time range report, to be able to query historical data and export to files.
- Work on InfluxDB queries.
- CLI interface - Eveything for inLine outputs
- Makes refresh based on timestamp instead of sleep time @harold Jan 13, 2022
- Display only running VMs. Dec 28, 2021
- CLI sort node and vm report by cpu, mem, etc @harold Dec 26, 2021
- CLI vm report @harold Dec 25, 2021
- CLI node report @harold Dec 17, 2021
- Interactive interface - top like interface
- Add VM list @harold Dec 27, 2021
- Node CPU graph @harold Dec 19, 2021
- Sort VMs @harold Dec 28, 2021
- Add CPU ready time to overall VM report @harold Dec 29, 2021
- Data exporter - Time range report, to be able to query historical data and export to files.
- Nodes time range report @harold Jan 9, 2022
- VM time range report @harold Jan 9, 2022
- Define export files in line protocol format @harold Jan 9, 2022
I had almost decided to change the name from sre_perf to nar for a while, to make it sound more UNIX like (I thougth about nstat but that's already in use), then one day it start lingering in my head as narf, that's when I remembered about Pinky and The Brain... the song "just say narf" is some sort of "jacuna matata" from Pinky, the reflection of The Brain just before the song is quite cliche but I still believe with a deep meaning.
Initially the letter F had no meaning, and it was there just to make the command sounds fun (fun things are memorable, more easy to remember), then a friend suggested Facilitator and I found it quite convenient.
Click on the image : )

"So what if the numbers don't make sense on a chart?
Who said you've got to be smart?
Paint your nose, chill some flan
And remember to pre-grease the pan"