This repository is the official implementation of ANOCE: Analysis of Causal Effects with Multiple Mediators via Constrained Structural Learning.
In the era of causal revolution, identifying the causal effect of an exposure on the outcome of interest is an important problem in many areas, such as epidemics, medicine, genetics, and economics. Under a general causal graph, the exposure may have a direct effect on the outcome and also an indirect effect regulated by a set of mediators. An analysis of causal effects that interprets the causal mechanism contributed through mediators is hence challenging but on demand. To the best of our knowledge, there are no feasible algorithms that give an exact decomposition of the indirect effect on the level of individual mediators, due to common interaction among mediators in the complex graph. In this paper, we establish a new statistical framework to comprehensively characterize causal effects with multiple mediators, namely, ANalysis Of Causal Effects (ANOCE), with a newly introduced definition of the mediator effect, under the linear structure equation model. We further propose a constrained causal structure learning method by incorporating a novel identification constraint that specifies the temporal causal relationship of variables. The proposed algorithm is applied to investigate the causal effects of 2020 Hubei lockdowns on reducing the spread of the coronavirus in Chinese major cities out of Hubei.
- Python 3.7
PyTorch>1.0numpypandasscipynetworkxmultiprocessingargparsepickleos
train.py- the implementation of ANOCE-CVAE.utils.py- graph simulation, data simulation, VAE utility functions, analysis of causal effects, and accuracy evaluation.- RealData:
covid19.pkl(andcovid19.csv) - the real dataset for the COVDI-19 outbreak, where the first column is the exposure (i.e. 2020 Hubei lockdowns), the last column presents the outcome (i.e. the increase rate of confirmed cases out of Hubei), and the middle 30 columns to 30 mediators (i.e. the selected major cities) ordered by cities' total migration scale during the data period (from Jan 12th to Feb 20th, 2020). Here, the information of cities' migration scale is scraped from Baidu Qianxi (https://qianxi.baidu.com/, credit to the code from https://github.com/samelltiger/baidu_qx).ANOCE_COVID19_Results.data- Saved results with 100 replications.Realdata_COVID19_Summary.ipynb- Summary code for tables and figures, written in Jupyter Notebook.- Figures - the interative graphical results on the real data analysis, stored in HTML format, and other figures.
- Simulation:
- Scenarios - the true graphs for four scenarios and six cases in the simulation studies.
S1_trueG.pkl: Scenario 1S2_trueG.pkl: Scenario 2S3_trueG.pkl: Scenario 3S4_trueG.pkl: Scenario 4s_ER1_trueG.pkl: Case ER1s_ER2_trueG.pkl: Case ER2s_ER4_trueG.pkl: Case ER4s_SF1_trueG.pkl: Case SF1s_SF2_trueG.pkl: Case SF2s_SF4_trueG.pkl: Case SF4
- ANOCE_Results - Saved results for each setting.
Table_S1_Summary.py- Summary code for Table S1 in the supplementary article.Table_S2_Summary.py- Summary code for Table S2 in the supplementary article.- Figures - the graphical results in the simulation studies.
- Scenarios - the true graphs for four scenarios and six cases in the simulation studies.
To train the model(s) in the simulation studies, run this command:
python train.py --data_type='simulation' --simu_G_file=<CHOICE1> --A_type=<CHOICE2> --node_number=<CHOICE3> --sample_size=<CHOICE4> --batch_size=<CHOICE5>
- CHOICE1 = 'S1_trueG.pkl', 'S2_trueG.pkl', 'S3_trueG.pkl', 'S4_trueG.pkl', corresponding to four scenarios in Section 5.1, respectively; or 's_ER1_trueG.pkl' to 's_SF4_trueG.pkl' corresponding to six cases in Section 5.2;
- CHOICE2 = 'Gaussian', 'Binary', corresponding to two types of exposure;
- CHOICE3 = 12, 32, according to the number of nodes in the selected scenario;
- CHOICE4 = 50, 500, according to the sample size in the selected setting;
- CHOICE5 = 25, 100, according to the sample size in the selected setting.
Example:
python train.py --data_type='simulation' --simu_G_file='S1_trueG.pkl' --A_type='Binary' --node_number=12 --sample_size=500 --batch_size=100
To evaluate my model on the outbreak of COVID-19 to investigate the effect of 2020 Hubei lockdowns with 100 replication, run:
python train.py --data_type='realdata' --real_data_file='covid19.pkl' --node_number=32 --sample_size=38 --batch_size=19 --rep_number=100
See more details on the collection and meaning of the COVID-19 Dataset in our main text.
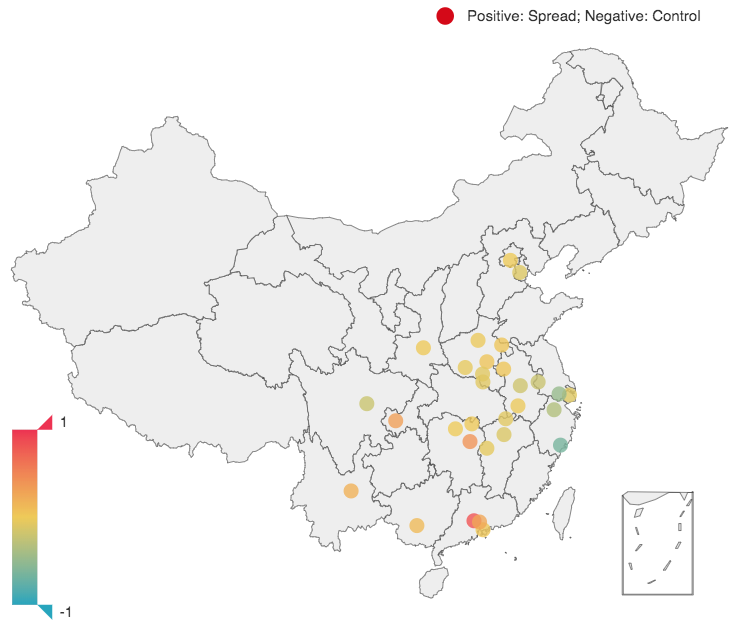
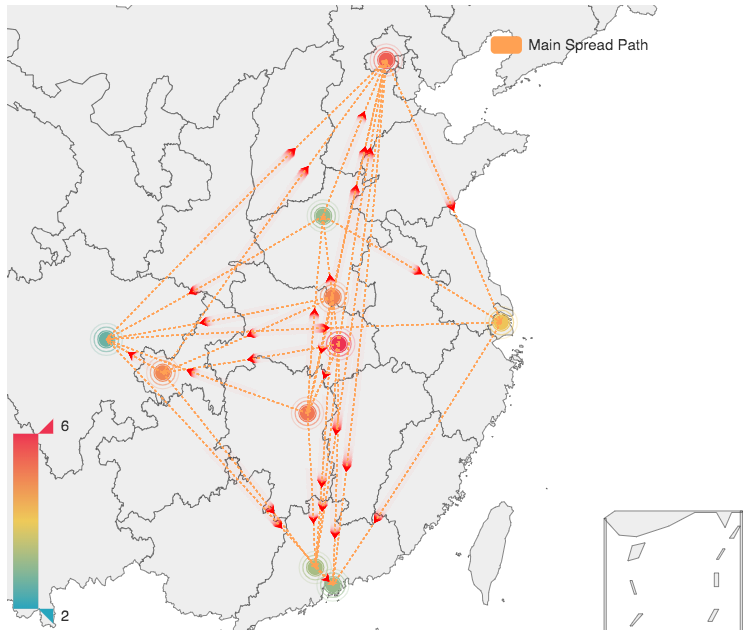
We conclude that by locking Hubei down, China successfully reduced 49.7% of the daily new confirmed cases out of Hubei; about 84% of which was the indirect effect contributed via the reduced migration of major cities outside Hubei. Additionally, we quantify the individual effect for each city, where the infection within cities has been effectively controlled while the secondary migration among cities exacerbated the pandemic under the lockdown. A spreading network is further provided to interpret the interaction trend among cities.
See cities' direct effects (DMs) here.
A snapshot for the above HTML:
See also cities' indirect effects (IMs) here.
A snapshot for the above HTML:
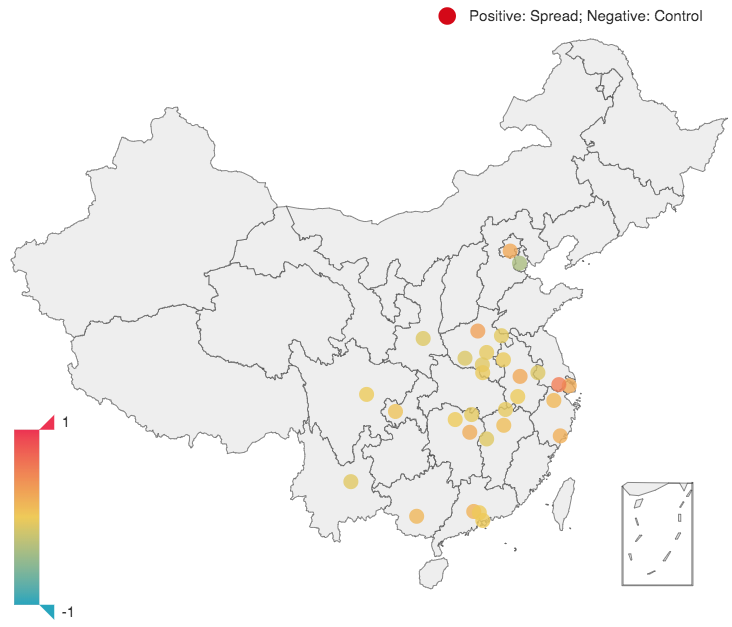
To better interpret the city's DM and IM, we divide the city's role in controlling the spread of the epidemic into two parts. The first part is the intensity of transmission within a particular city, which represents the infection within the city and corresponds to the direct effect of the mediator. The other part is the secondary migration of a particular city (the infected people from the area to other places) and thus is the indirect effect of a mediator. Clearly, a positive effect means spreading the virus while negative means control.
A spreading network is further provided to interpret the interaction among cities.
A snapshot for the above HTML:
Our work and code benefit from existing works, which we are very grateful.
- DAG-GNN https://github.com/fishmoon1234/DAG-GNN
- DAG NOTEAR https://github.com/xunzheng/notears