observability
Monitoring and debugging tools with a unified dashboard.
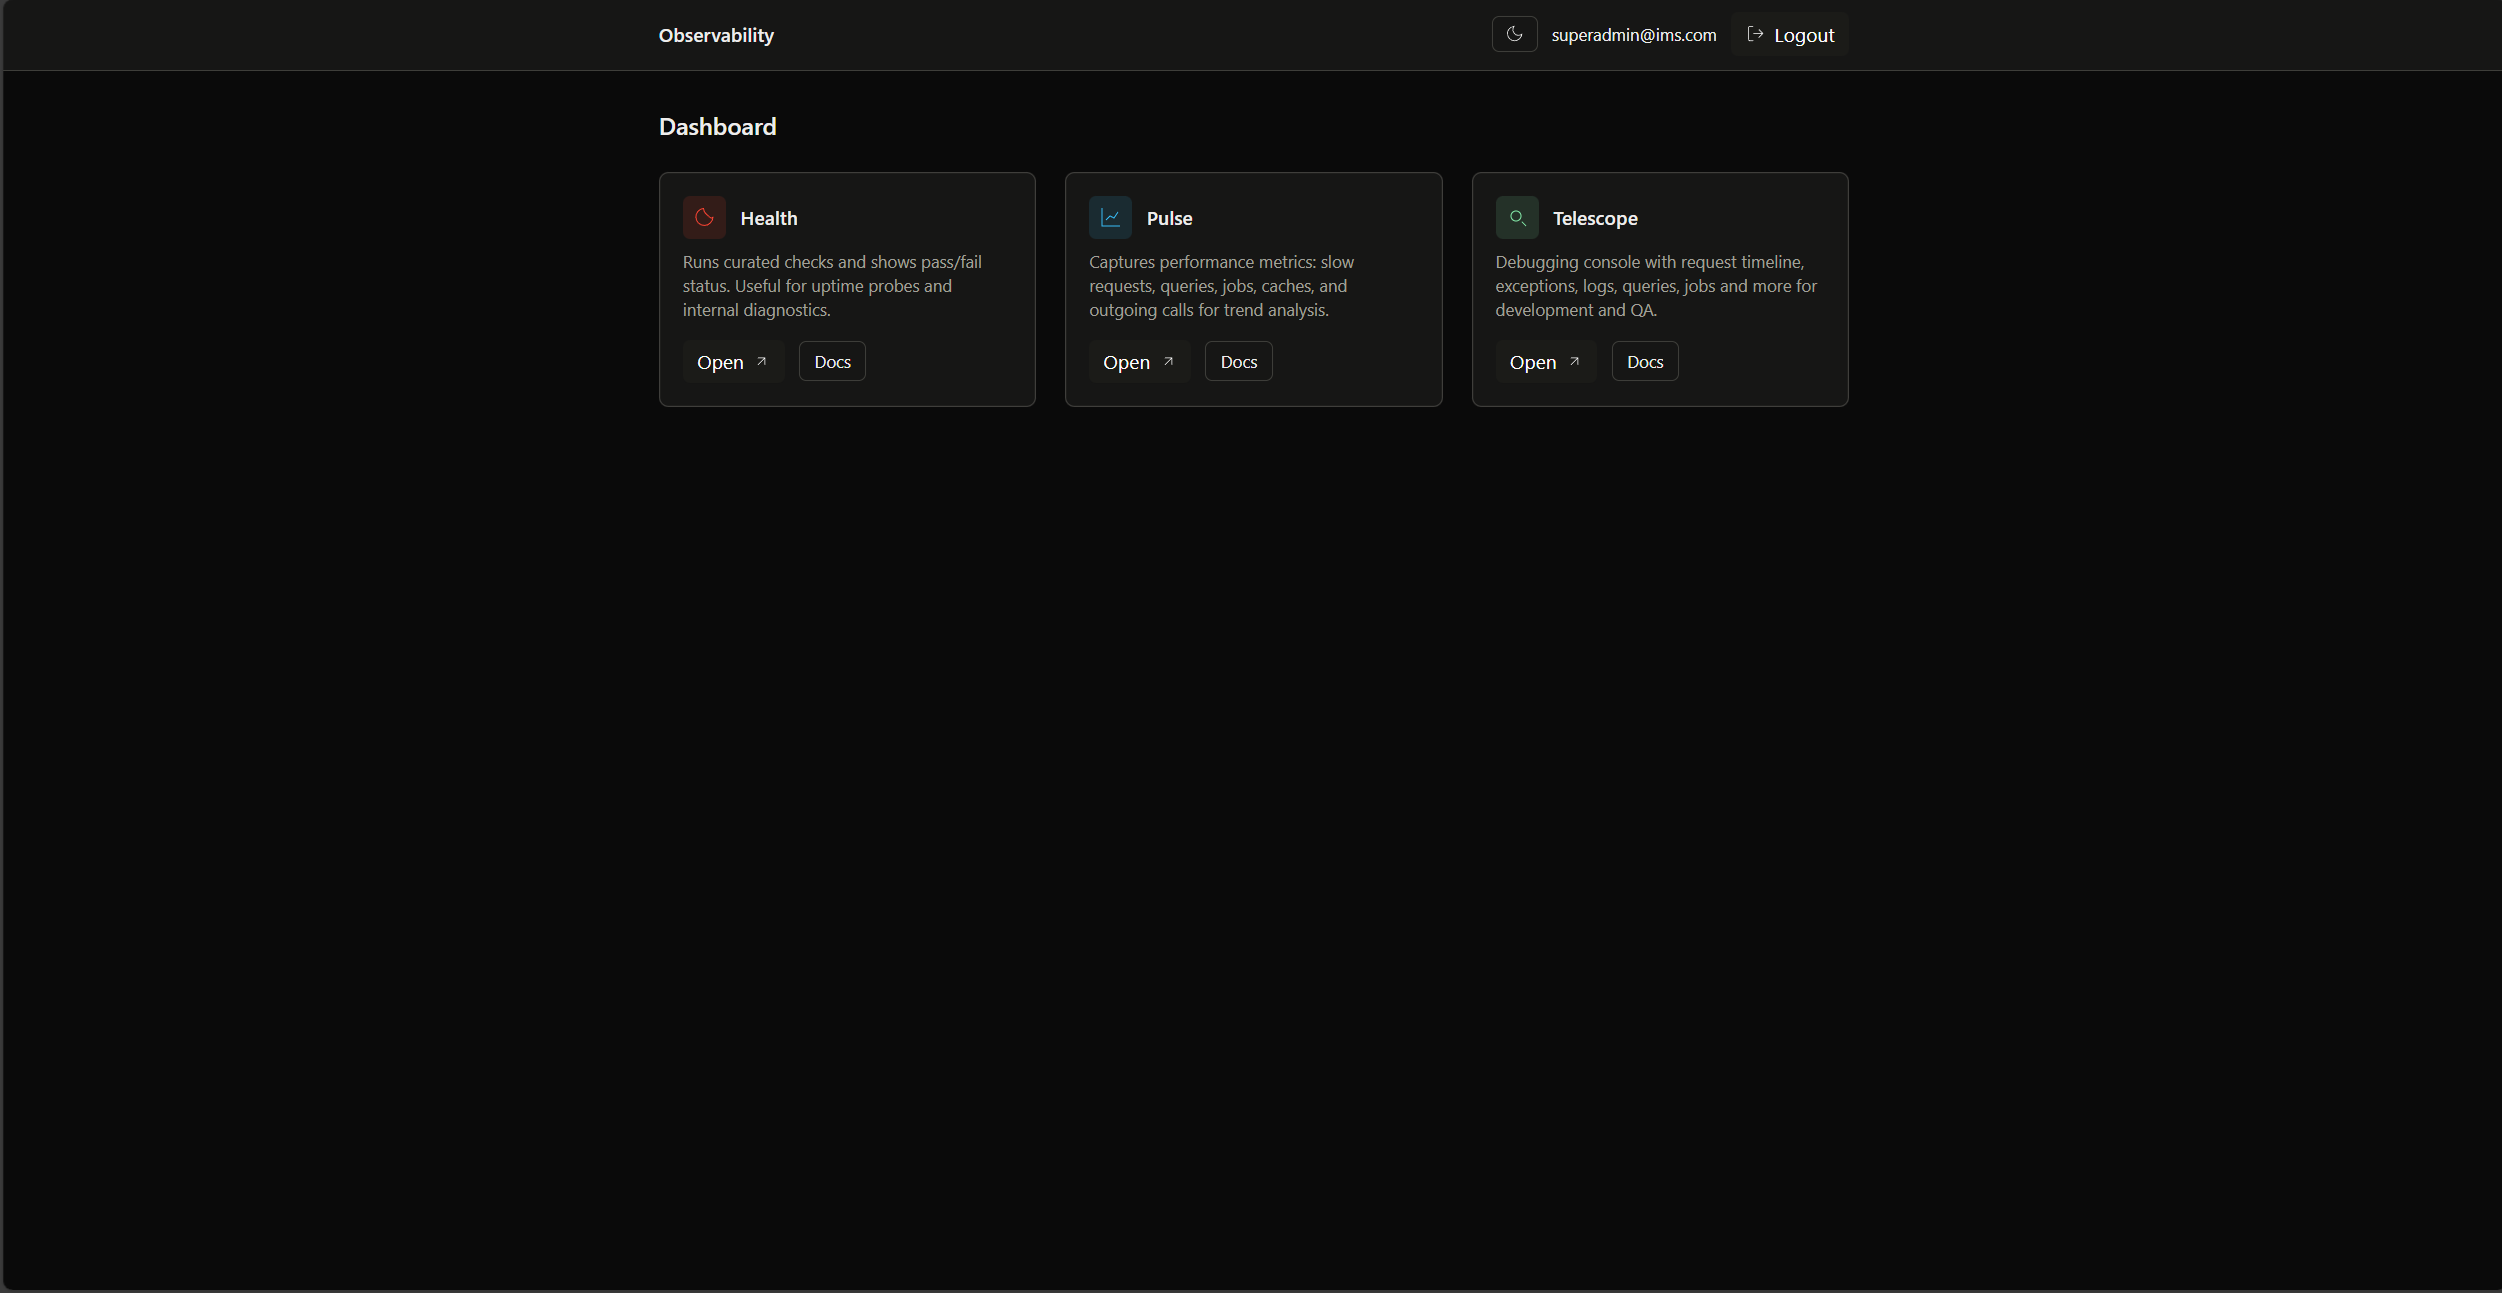
Observability Dashboard
URL: http://localhost:8000/observability
Central hub for all monitoring tools with built-in authentication.
Features:
- Request monitoring with timing
- Database query analysis
- Exception tracking with stack traces
- Cache performance monitoring
Access: Through observability dashboard
Features:
- Real-time application metrics
- User analytics and activity
- Slow query detection
- Queue performance monitoring
Access: Through observability dashboard
URL: http://localhost:8000/api/health
Comprehensive system health status check returning JSON response. For detailed check descriptions and response structure, see App Health Check.
Key Checks:
- System (Environment, Debug Mode, Disk Space)
- Application (Cache, Optimized App)
- Services (Database, Queue, Schedule)
- Custom (Migration Status)
All observability tools require authentication via built-in middleware.
Environment variables:
OBSERVABILITY_ENABLED=true
OBSERVABILITY_AUTH_ENABLED=falseTools not loading:
php artisan optimize:clear
php artisan telescope:prune
For detailed documentation, see the Features Guide.