An interactive, end-to-end A/B testing framework with Streamlit
Un dashboard interactivo de A/B Testing para Marketing Science
| Page | What it does |
|---|---|
| Dataset | Load synthetic or your own CSV data, EDA, timelines |
| Experiment Design | Sample size calculator, MDE sensitivity, timeline estimator |
| SRM Validation | Sample Ratio Mismatch detection (Chi-Square test) |
| Statistical Analysis | Frequentist Z-test + Bayesian Beta-Binomial + Segment analysis |
| Business Report | Executive summary, revenue projections, downloadable results |
A/B testing is the practice of running controlled experiments to measure the causal impact of a change - a new landing page, button color, email subject line, pricing strategy, etc. Instead of guessing what works, you let the data decide.
This dashboard implements a complete, production-grade A/B testing workflow:
Define experiment -> Calculate sample size -> Run experiment
Validate integrity (SRM) -> Statistical test -> Business decision
- Synthetic data generator - realistic e-commerce dataset (LATAM market, 45K users, 14 days) out of the box
- Upload your own CSV - plug in any binary A/B test dataset
- Sample size calculator - with power/alpha controls and sensitivity curves
- SRM Check - detects broken experiment assignment before you even look at results
- Frequentist Z-test - confidence intervals, p-values, achieved power, peeking warnings
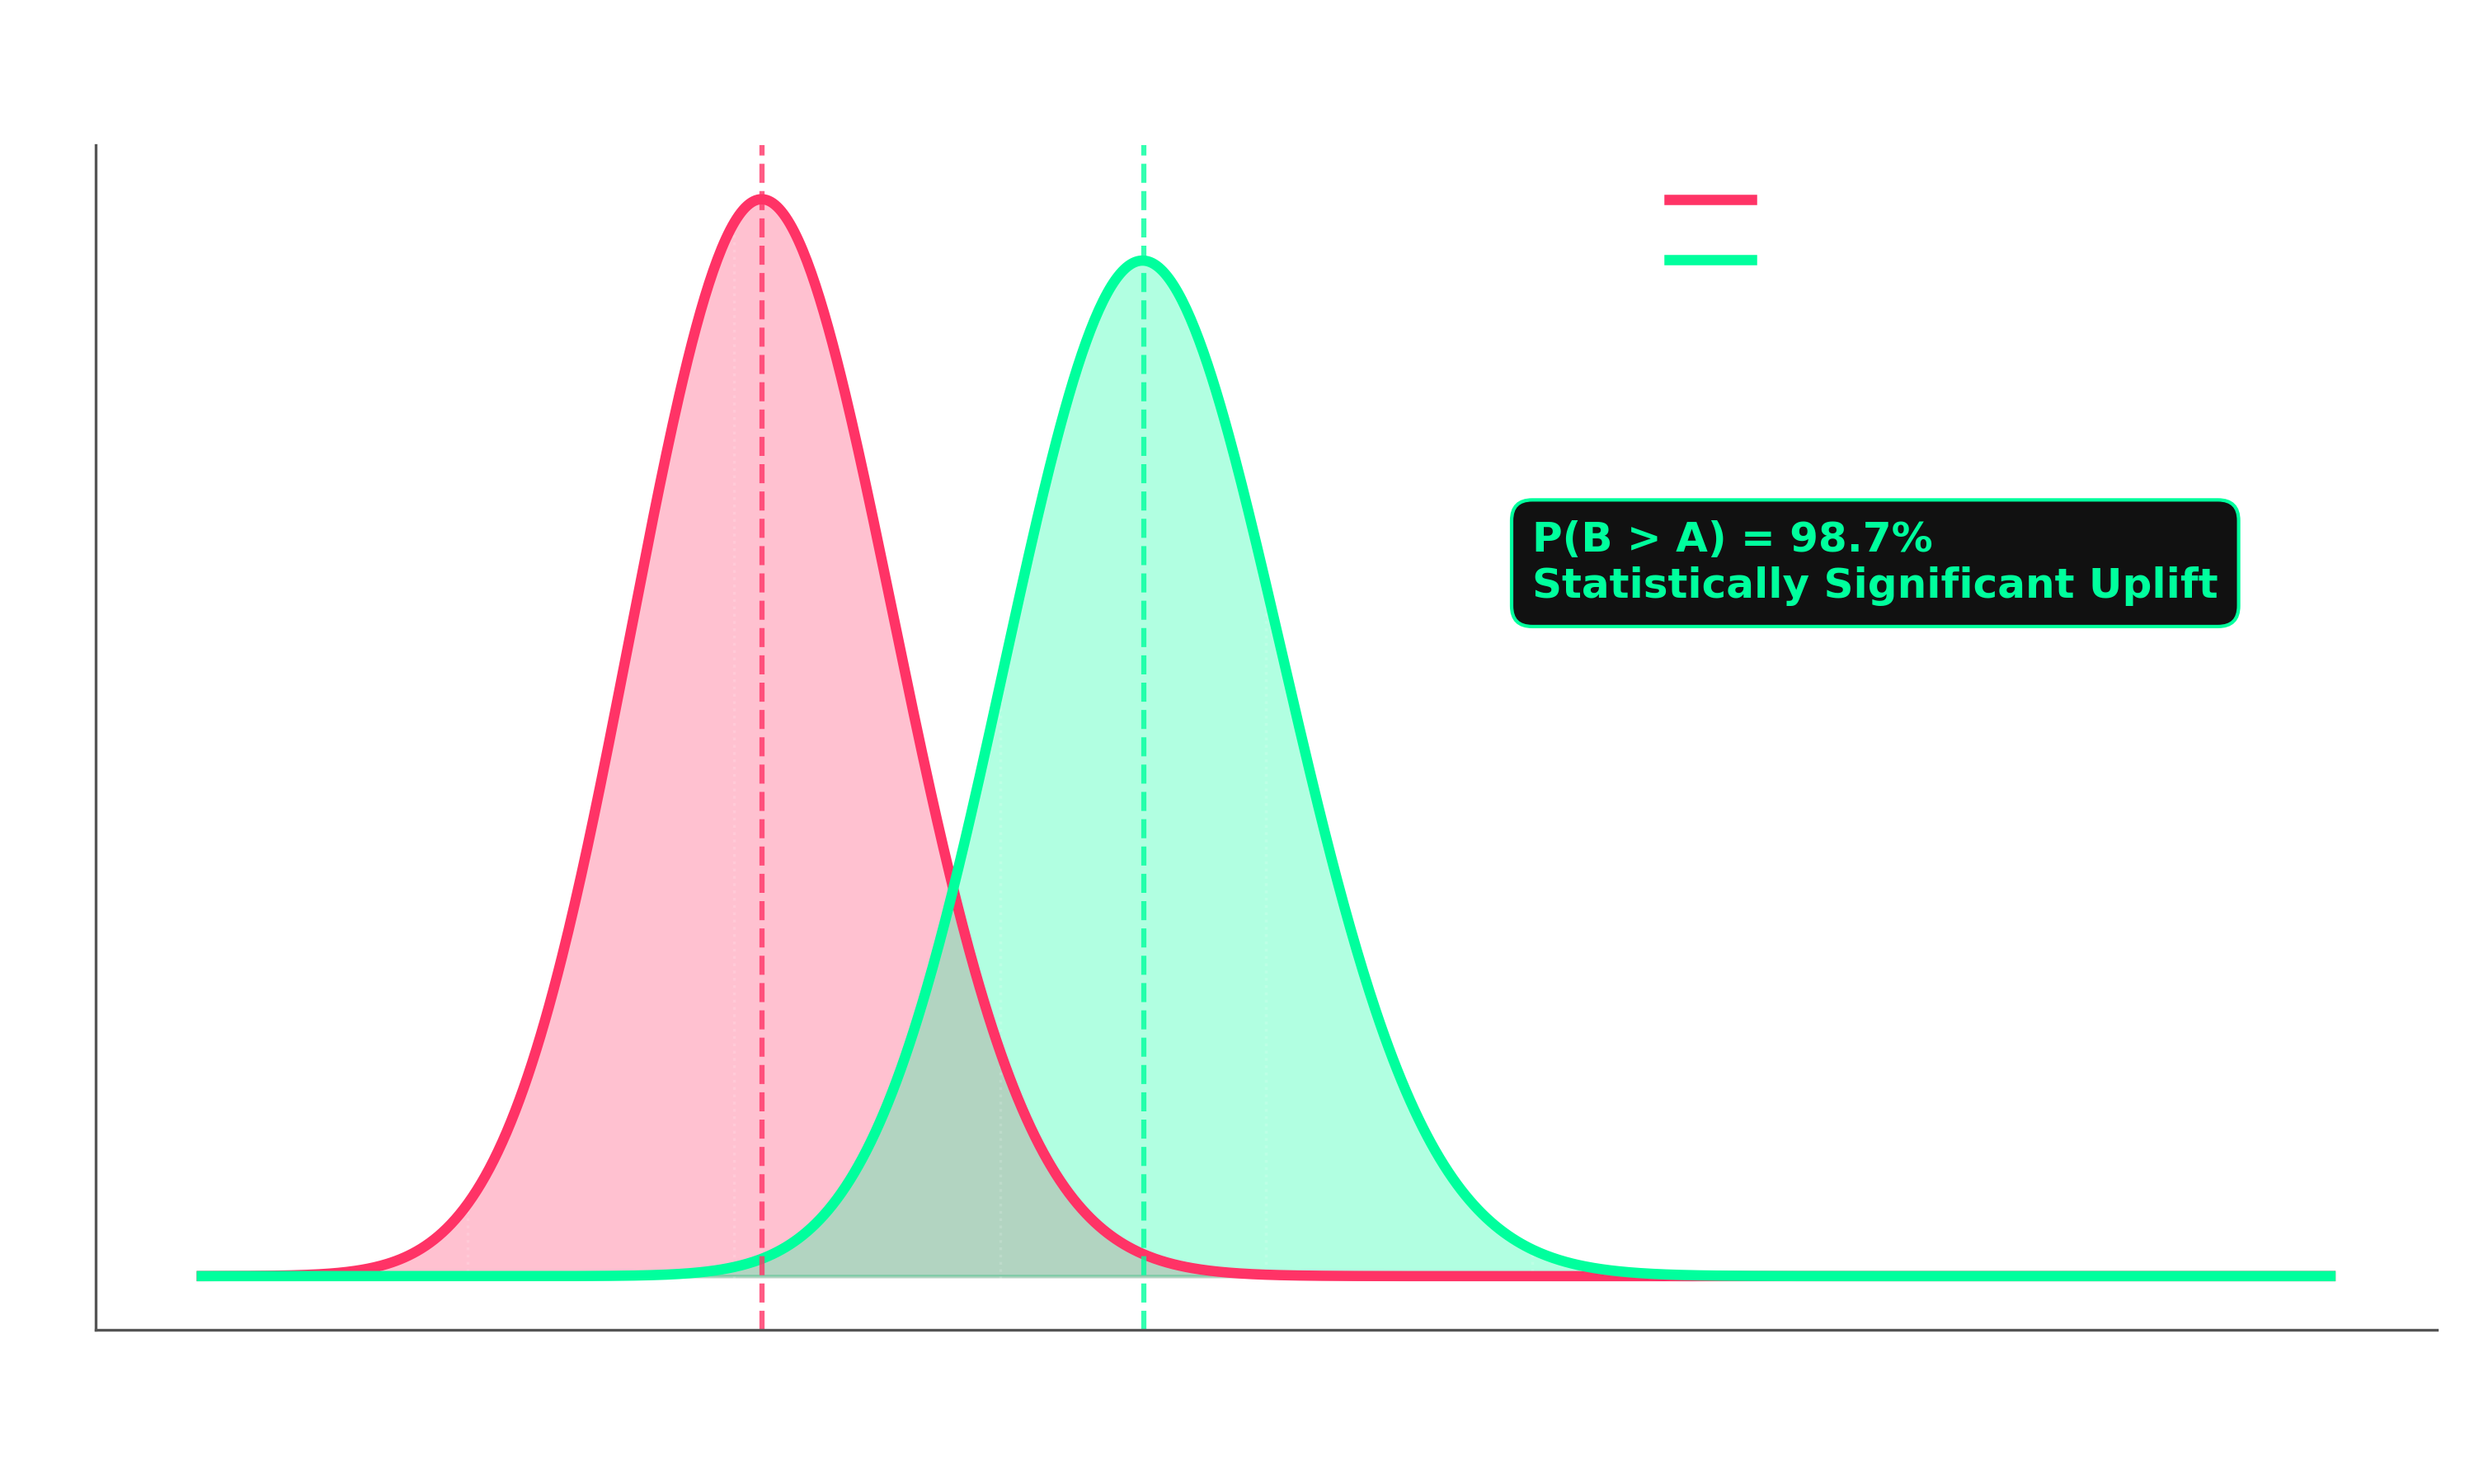
- Bayesian analysis - posterior distributions, P(B>A), expected loss framework
- Segment analysis - forest plots by device, country, or any categorical column
- Revenue impact projection - monthly & annual uplift based on your traffic and AOV
- Export results - download full report as CSV
# Clone
git clone https://github.com/JulianDataScienceExplorerV2/Marketing-AB-Testing.git
cd Marketing-AB-Testing

# Install dependencies
pip install -r requirements.txt

# Run the app
streamlit run app.py
Then open http://localhost:8501 in your browser.
Marketing-AB-Testing/
├── app.py                      # Main Streamlit dashboard (5 pages)
├── src/
│   ├── statistics.py           # Sample size, SRM, Z-test, Bayesian
│   └── data_generator.py       # Synthetic e-commerce data
├── data/                       # Drop your CSV files here
└── requirements.txt
| Tool | Purpose |
|---|---|
Streamlit |
Interactive web dashboard |
Scipy / Statsmodels |
Statistical tests, power analysis |
NumPy |
Bayesian sampling, numerical ops |
Plotly |
Interactive charts (forest plots, posteriors, CI viz) |
Pandas |
Data manipulation |
El A/B testing es la practica de correr experimentos controlados para medir el impacto causal de un cambio - una nueva landing page, un boton de diferente color, el asunto de un email, una estrategia de precios, etc. En vez de adivinar que funciona, dejas que los datos decidan.
Este dashboard implementa un flujo completo de A/B testing listo para produccion:
Disenar experimento -> Calcular tamano de muestra -> Correr experimento
Validar integridad (SRM) -> Test estadistico -> Decision de negocio
- Generador de datos sinteticos - dataset de e-commerce realista (mercado LATAM, 45K usuarios, 14 dias)
- Sube tu propio CSV - conecta cualquier dataset de A/B test binario
- Calculadora de tamano de muestra - con controles de power/alpha y curvas de sensibilidad
- SRM Check - detecta asignacion rota antes de mirar resultados
- Z-test frecuentista - intervalos de confianza, p-values, power alcanzado
- Analisis bayesiano - distribuciones posteriores, P(B>A), expected loss
- Analisis por segmentos - forest plots por device, pais, o cualquier columna categorica
- Proyeccion de impacto en revenue - uplift mensual y anual segun tu trafico y ticket promedio
- Exportar resultados - descarga el reporte completo como CSV
# Clonar
git clone https://github.com/JulianDataScienceExplorerV2/Marketing-AB-Testing.git
cd Marketing-AB-Testing

# Instalar dependencias
pip install -r requirements.txt

# Correr la app
streamlit run app.py
Luego abre http://localhost:8501 en el navegador.
| Concept | Description |
|---|---|
| MDE | Minimum Detectable Effect - the smallest lift worth detecting |
| SRM | Sample Ratio Mismatch - mismatch in group sizes signals a broken experiment |
| Power | Probability of detecting a real effect (typically 80%) |
| a (alpha) | Significance level - acceptable false positive rate (typically 5%) |
| Peeking | Stopping early when p < a - inflates false positive rate |
| Expected Loss | Bayesian metric: how much conversion you risk by picking the wrong variant |
Made with code by JulianDataScienceExplorerV2
Data-driven decisions, not gut feelings.