- Problem Statement
- Goal
- EDA interesting points
- Data pre-processing
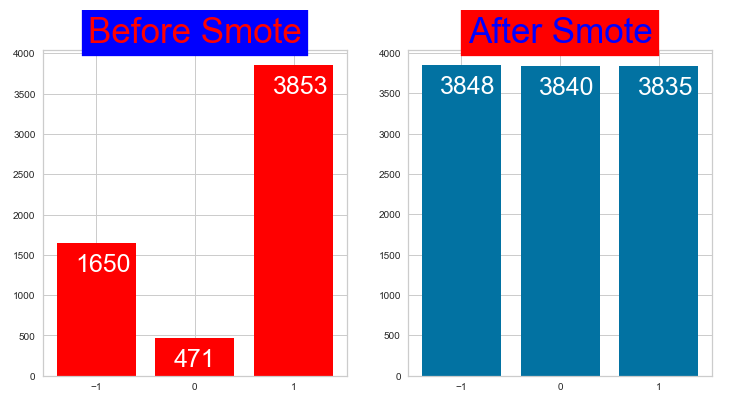
- Label manipulation before training models
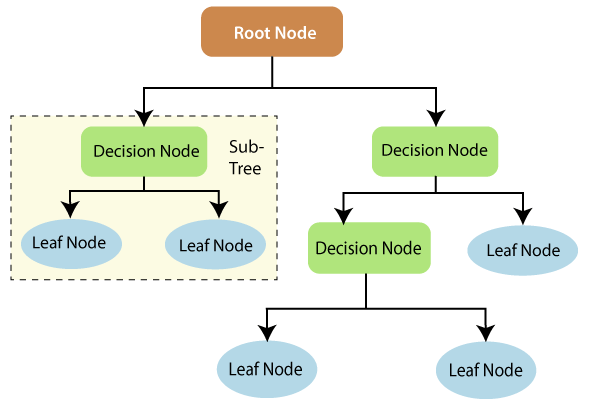
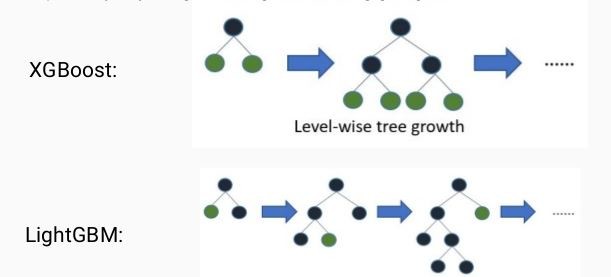
- ML models used
- ML EDA
- need to maximise adoption rates to ensure adoption shelters are not completely dependent on government funding as well as to improve the quality of life of animals and pet owners.
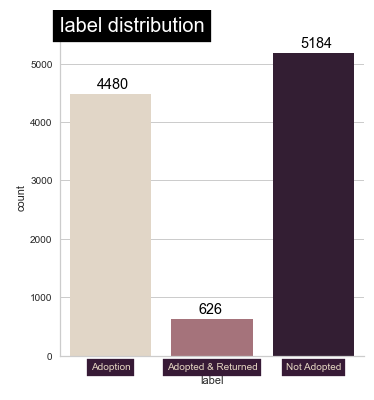
- This is based off our label: (Adopted, adopted and Returned & Not adopted)
- to assist shelters in identifying features to take note of when trying to improve adoption rates.
Side note: The most notable issue with this dataset is that it does not have any numerical/continuous data for me to manipulate. I must adjust everything to turn them into numbers
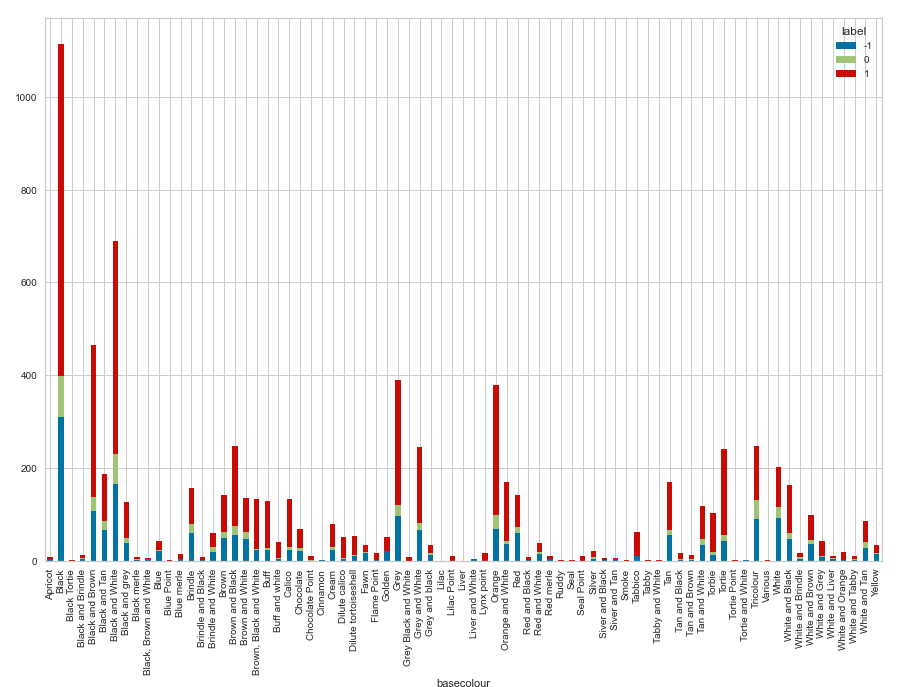
- Black cats and dogs have the highest abandon and adoption rates
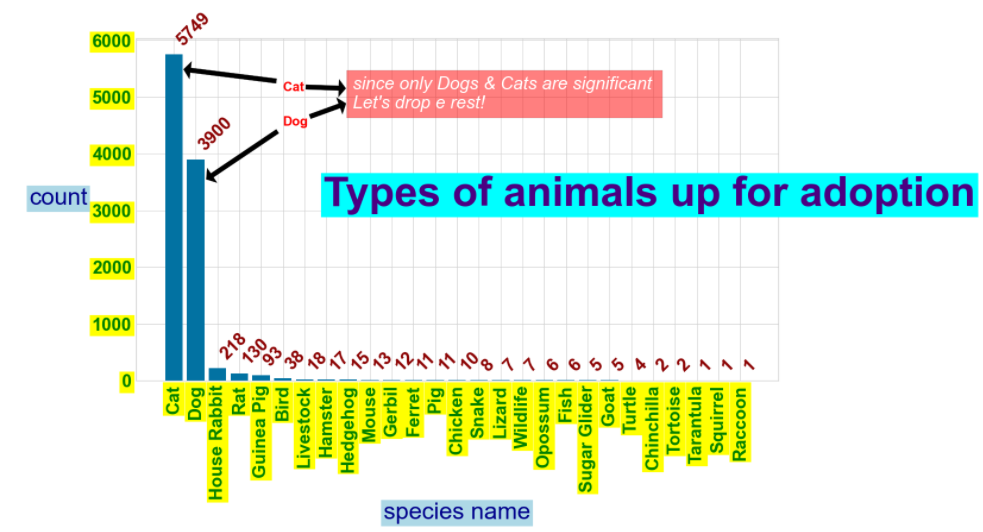
- cats & dogs are the most popular animals to be abandoned
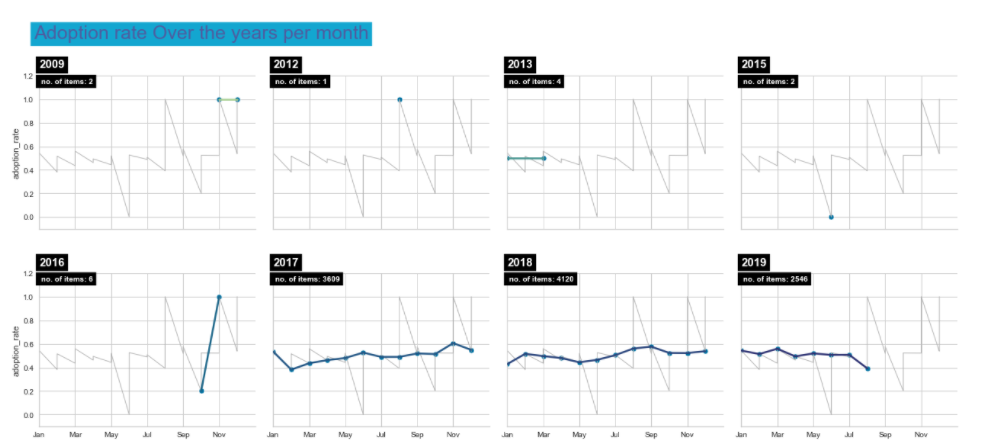
- Adoption rate is not time sensitive
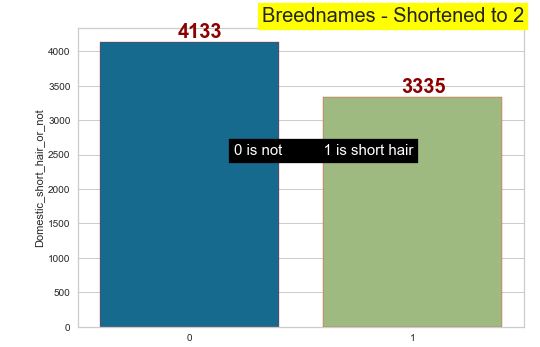
- The most abandoned breed is the domestic shorthair in both cats and dogs (so much so that we can shorten them to a new column)
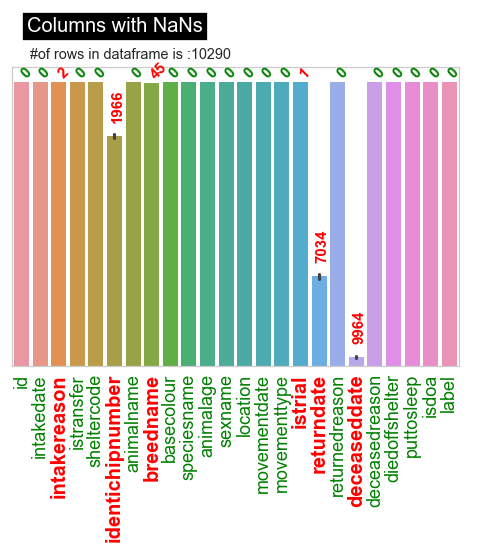
- Such as deceaseddate, returneddate & identichip indicate alive, not returned and not chipped respectively
- Other items missing will have their entire row dropped
- Data needs to be in numbers for the Machine to read, these numbers shoud also make sense in the real world.
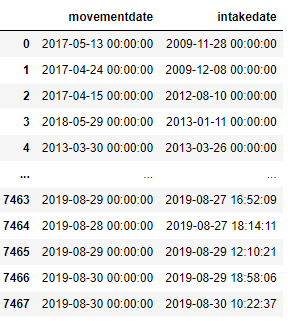
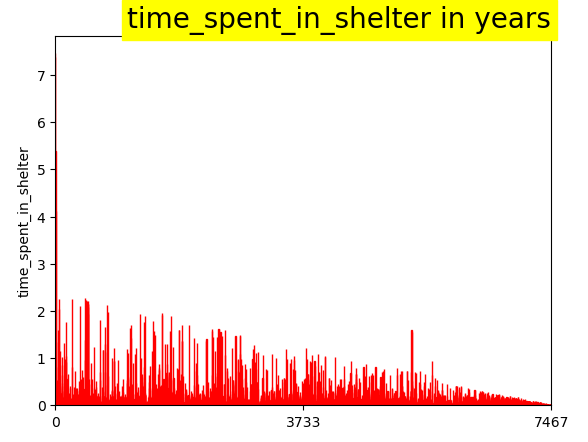
- getting Total time spent in shelter with intake and movement date
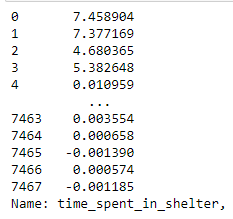
- Negative timing is due to the same day dates being reversed is terms of newer and older dates. easily solved with abs() function
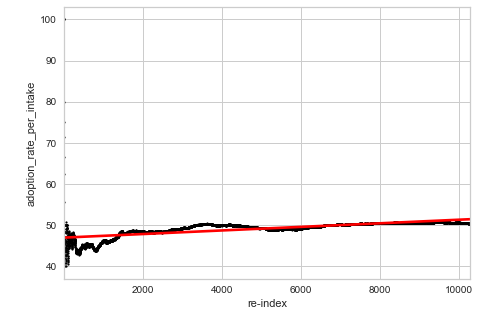
- Obtained via dividing current adopted with total number of animals. Caveat is that first few entries will be very skewed and jumpy on the graph
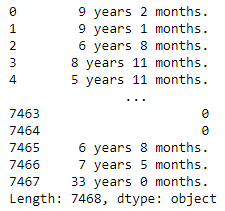
- Dataset column is riddled with:
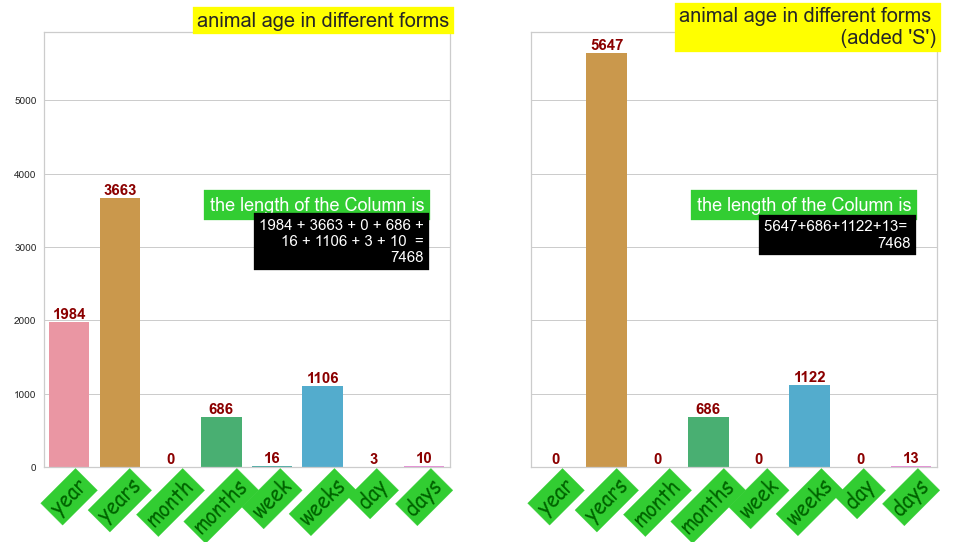
- strings where days, weeks & months need to be converted into years
- Regular expression usage to achieve this
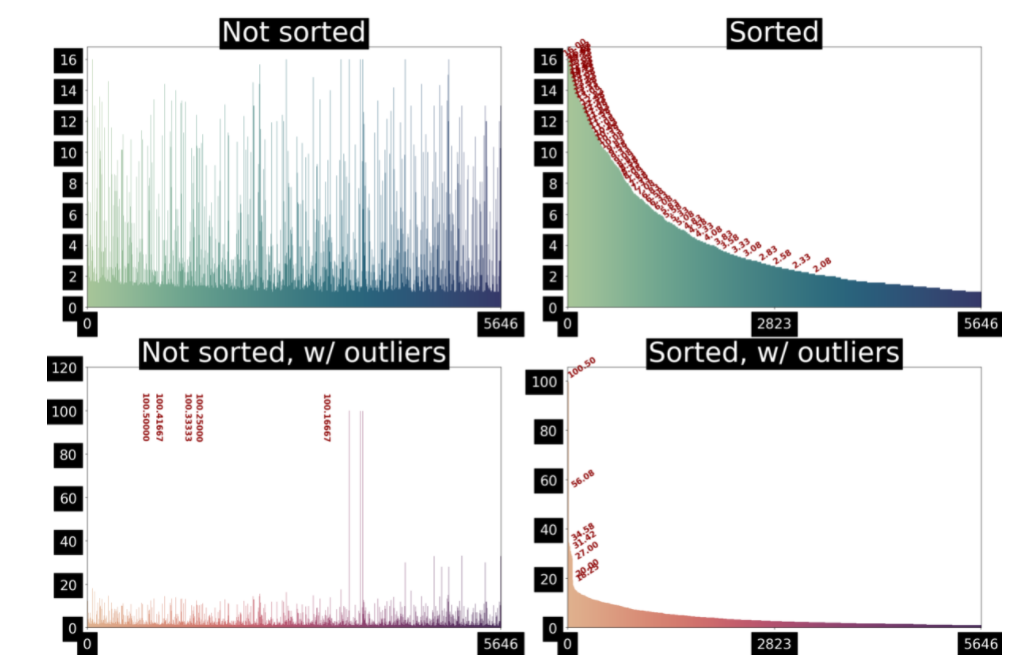
- outlier errors which need to make sense. Data that is on extreme ends can affect certain ML models
- better to keep the data's SD relatively low
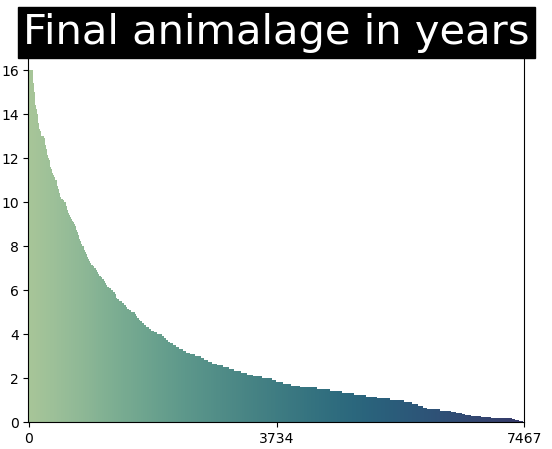
- Here i chose to replace the outlier age (100 year old cats/ dogs) with the googled average maximum age of a cat/dog
- strings where days, weeks & months need to be converted into years
- SMOTEtomek was chosen to remove the nearest neighbours smoted to ensure data is not to0 cluttered
Utilizing various Machine learning algorithmns and libraries to get the best model
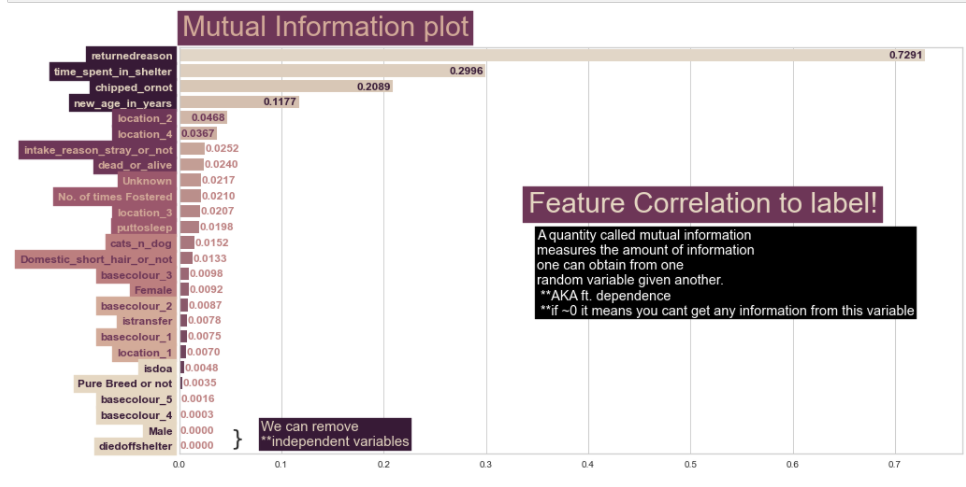
- MIP plot (we can see that the top 4 features that affected the Model the most were:
- returned reason
- Time spent in shelter
- chipped or not
- animal's age
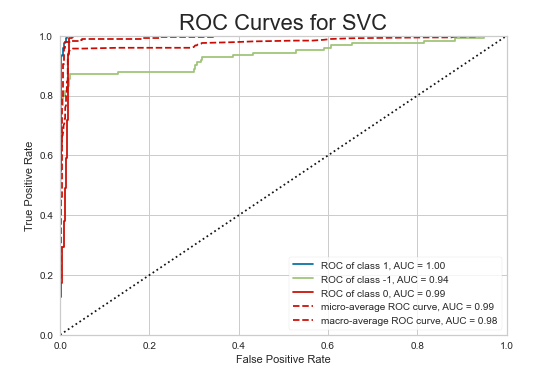
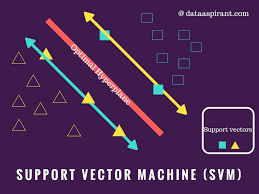
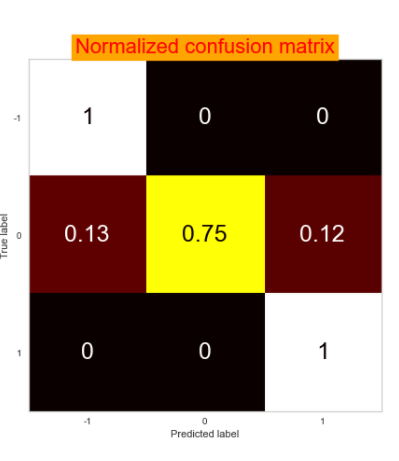
- Ultimately the Support vector Machine model was the best:
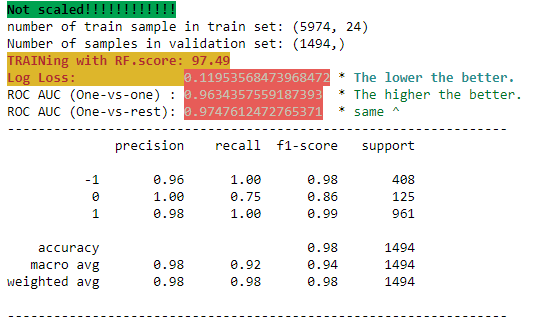
- 100% recall on adopted & not adopted labels
- 100% precision on adopted & returned label
- ROC OVO (micro on graph) 98%
- log loss very very low at 0.119 where logloss = 1.1 is when i myself randomly choose and label the data without any model.