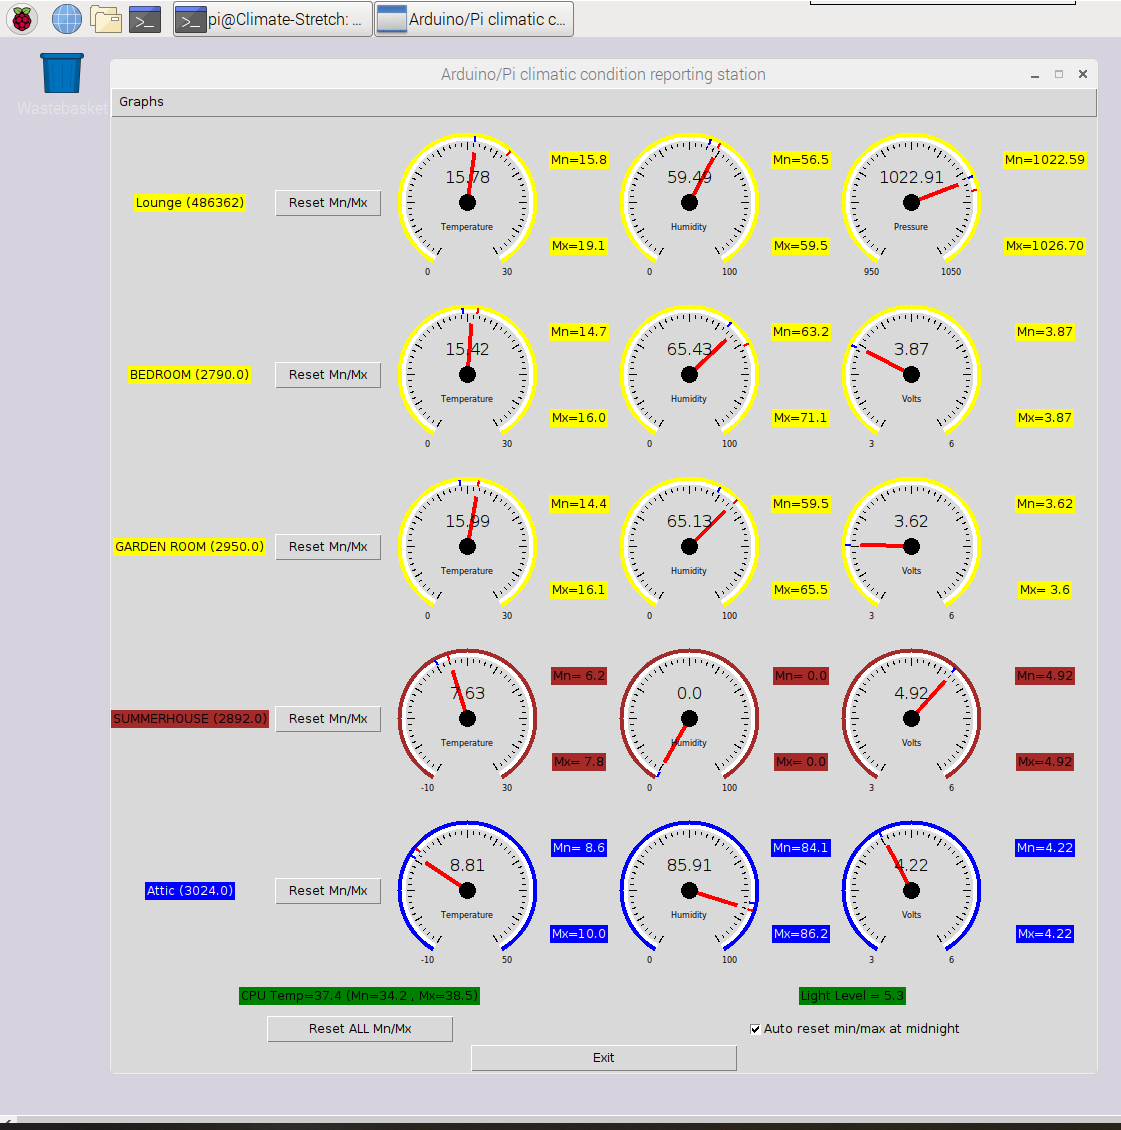
Household climate monitoring with a Pi ZeroW and some homebrew Arduinos using 433MHz.
RUN WITH PYTHON3.
Currently working on Stretch OS.
Only pre-requisite is gnuplot. Install using sudo apt-get install gnuplot-x11.
Touchscreen display is uLCD-32WPTU from 4D systems.
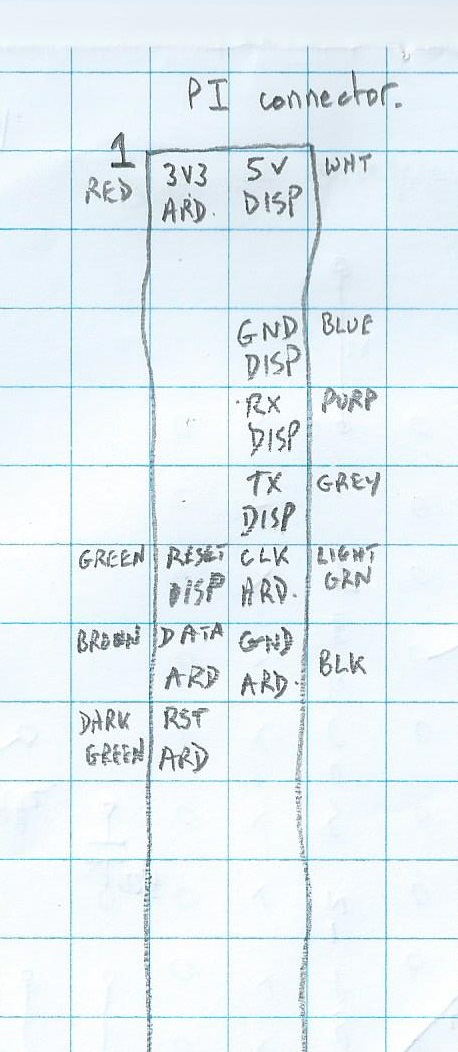
MASTER Arduino unit is connected to Pi over a proprietary 3 wire interface (CLK, DATA, RST).
This gathers all the RF data from the 4 SLAVE Arduinos and presents a single message to the Pi.
All temperatures are transmitted in Deg C. All humiditys are RH%. All pressures are mB.
- MASTER Arduino is the slave to the Pi. Pi toggles reset, then clocks data in looking for three commas to terminate.
- At startup a day change is detected and a filename with that days timestamp is created and an array created that will store records.
- at approx 1 minute intervals.
- At midnight the contents of the array are written to the filename,a new filename is generated and the array cleared.
- At midnight, gnuplot is run externally to produce two graphs (PNG files) (temperatures and humiditys).
- At midnight a timer is invoked such that at 6:30AM an email containing the two png files and all the previous days' data is sent.
- At 6:30AM, if the data fails to send then keep retrying at half hour intervals.
- If the temperature in the shed reaches level1 (25C) or level2 (35C) send a single email per day.
The internal Pi serial port is connected to a touch screen LCD (320 * 240).
- This normally displays all the current temperatures.
- Touch the screen in the lower half to show min/max/badCRC and time since last message. While in this screen, touching the display again resets all of the above values and changes back to displaying the temperatures.
- If no touch is detected on the screen for 60s then its backlight is turned off to conserve power. Touch it to get display on again.