We have provided the python code (DataVis.py) and an example dataset (ExampleInput.xml) above. If you want to run the project see bellow for instructions.
Goal: This project aims to create a visualization for domain experts wanting to understand their own analysis or exploration processes (reflection). In other words we are trying to highlight patterns in their explorations.
The Dataset: Automatically generated log files of user interactions with a visualization tool (124k lines of xml, 17 fields). The data was collected during four interactive exploration sessions of agronomy models with domain experts. The experts wanted to analyse various trade-off scenarios.
Our visualisation choice: A parallel axis graph that shows the patterns in the actions and dimensions with the ability to filter the data and explore different lengths of patterns.

The darker a stripe is, the higher its count is. the count represents the number of times a pattern has been seen in the data. the parallel axis contain the actions that constitute the paterns
Interaction & Filters:
- The ability to load any Xml log file.
- The ability to generate a graph for actions or dimensions.
- The patterns are highlighted on mouse hover and their counts are displayed
- The ability to choose the length of the patterns to display (2-10) .
- Min/max filters for the pattern counts.
- Inclusion/Exclusion filters for the actions (not yet implemented for dimensions).
- "No loop" filter to remove the instances where an action loops over itself.
- The Ability to save/download a Png of the generated graph (to keep or share).
Video Demo (Previous version|before reviews):
https://www.youtube.com/watch?v=p8_xa7Fg_ww&feature=youtu.be
The code for this project was made using python 3.7
install Dash
pip install dash==1.8.0
Plotly should be installed automatically once you install Dash but if for some reason you do not have it even after installing Dash here is the Link to install Plotly
install Pandas
pip install pandas
-Download DataVis.py and ExampleInput.xml.
-Run DataVis.py with the command python DataVis.py
-The program will launch a local server and give you the address it is running at
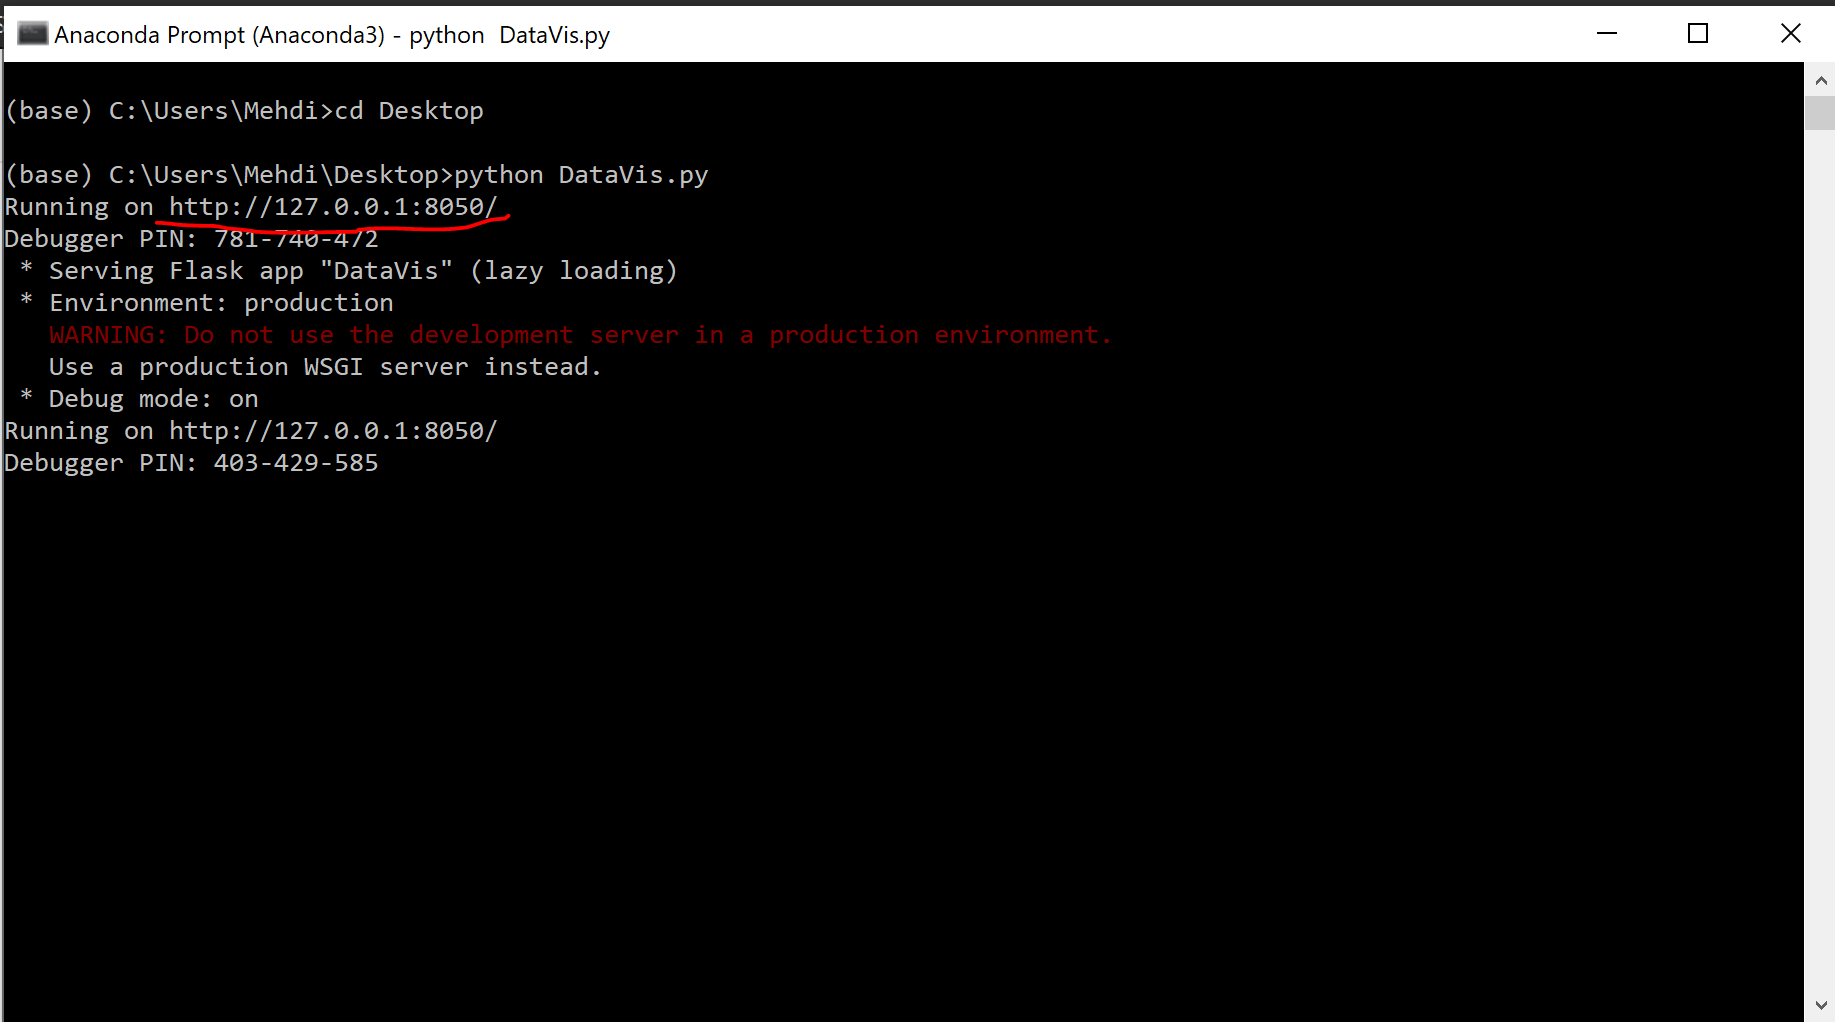 -Copy the address in your browser of choice
-Done! you can upload ExampleInput.xml with the file chooser and interact with the visualisation.
