Prototype proof-of-concept model generating predicted probabilities that groups of farmers will default on the repayment deadline. The SQL SP release version is here.
A group-level default event is defined as any single client within a lending circle defaulting on their loan at the repayment deadline (OAF provides loans without repayment plans and with just a single repayment due date, so "days-past-due" etc. are not applicable here). If a single member of a group defaults, then her entire group (6-12 members) is black-listed for subsequent seasons. This has significant implications for client growth. The aim of this model is to identify groups at risk of default, and flag them for action from OAF loan officers and/or call centres.
The prototype model is currently in action across Kenya, Rwanda and Tanzania, representing >85% of our clients. Model scoring yields a cross-validation AUC score of 0.9 - 0.95 (depending on the country).
The model can be broken down into 3 (automated) stages, data cleaning, model building and finally predictions.
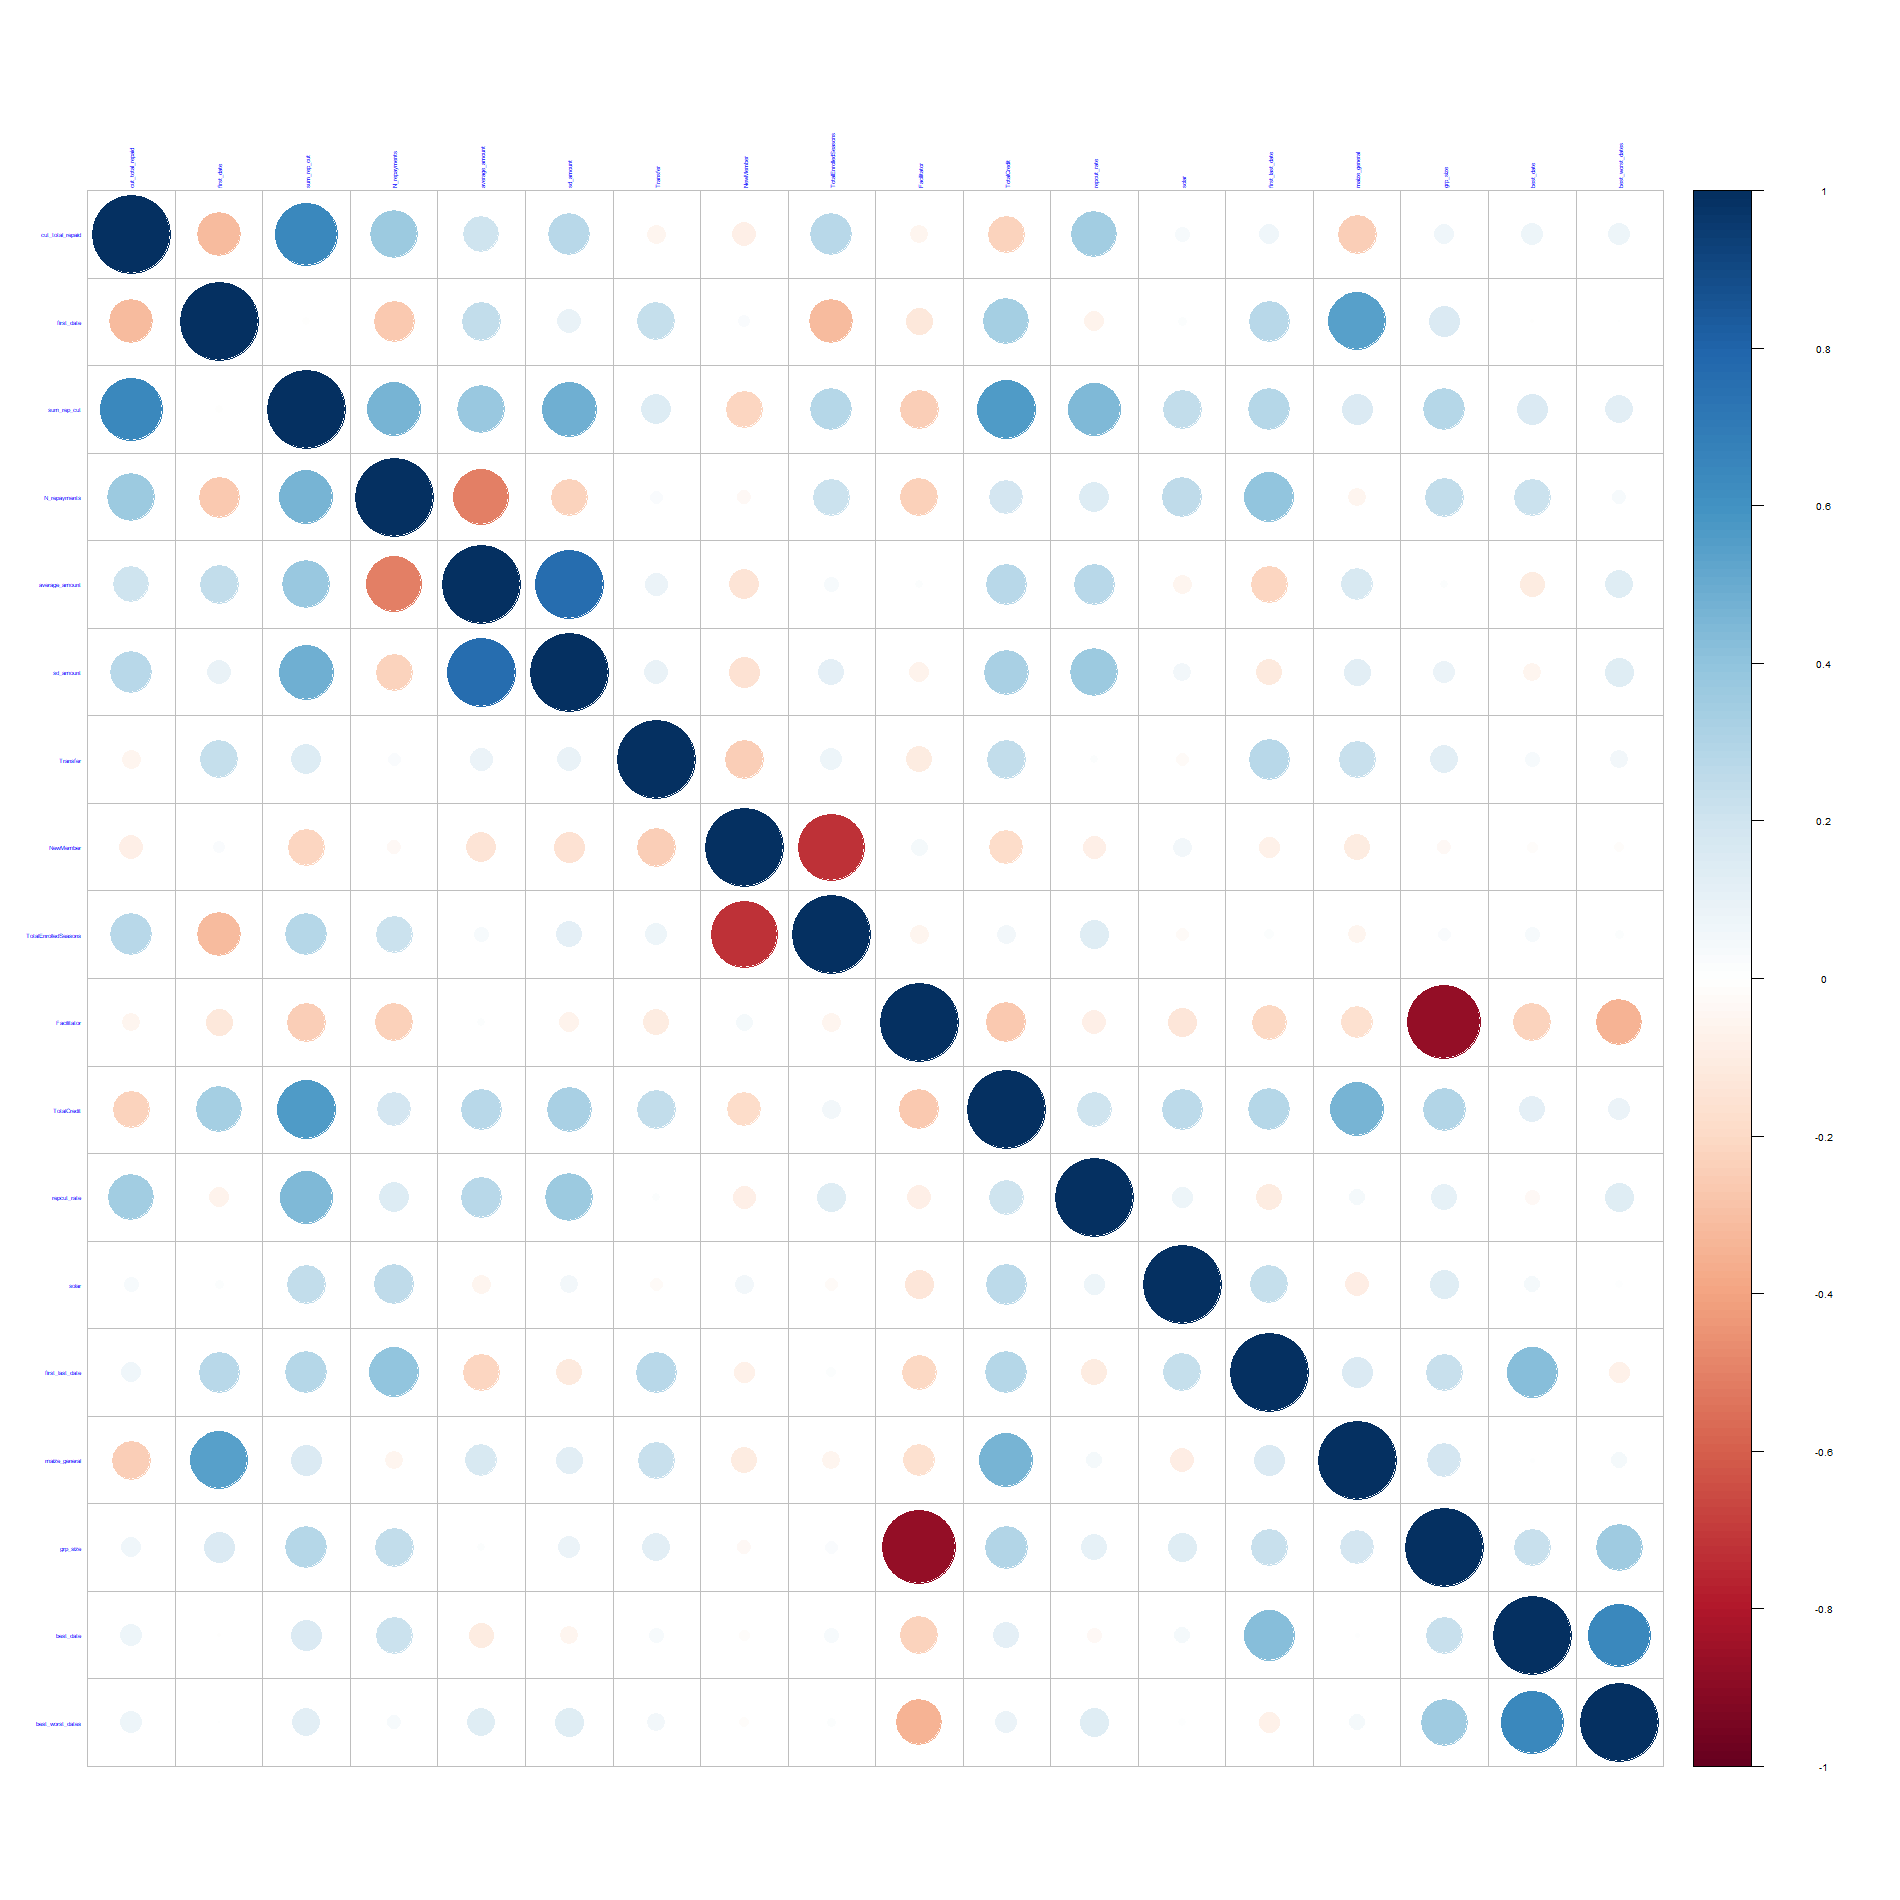
Data are first cleaned and then summarized at the group level, this is also where new features are constructed (e.g. looking at group cohesion through spreads on repayment dates and amounts). At this point we check for multi-collinearity amongst our variables and drop any variables with high correlation:
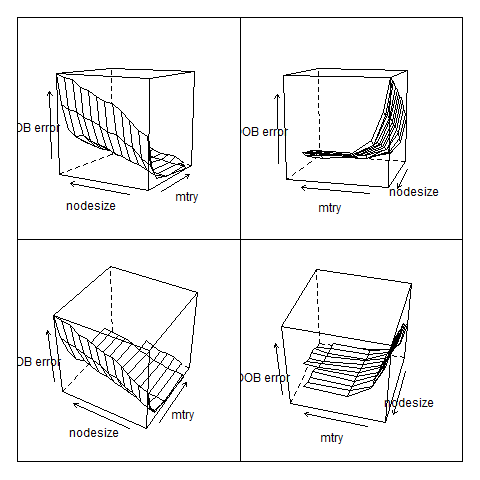
With clean data we can start model building and testing. First there are options for recursive-feature extraction and model stability checks (which increase runtime). Once these checks are complete a small RF is grown and nodesize and mtry optimized for minimal OOB error (a mixed gradient descent and grid-search approach):
Once parameters are optimised on this smaller RF, a larger RF is grown with the aim of establishing an optimal cutoff point between classes:
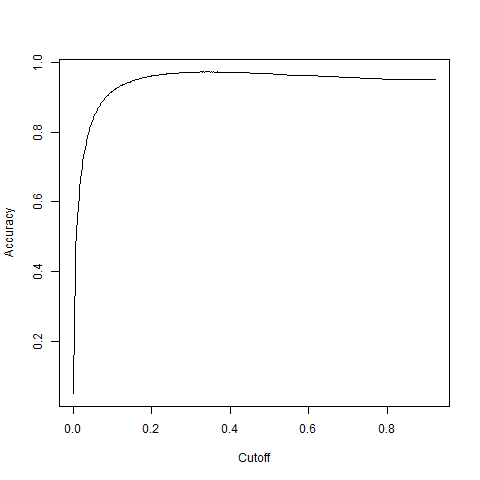
The aim of this cutoff is to minimise false positives and maximise true positives:
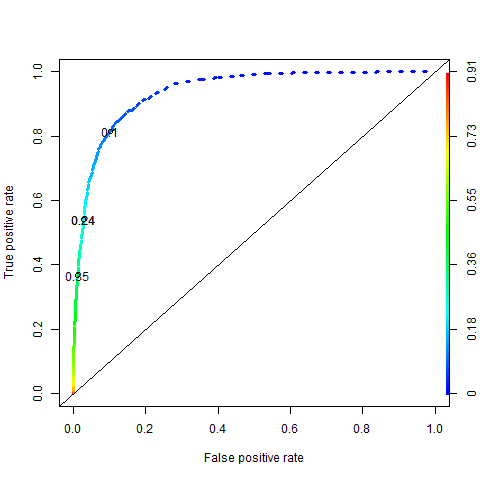
However, given the importance of preventing default and subsequent black-listing, false negatives are penalized more heavily than false positives (the exact ratio of penalties depends on the historical default rates).
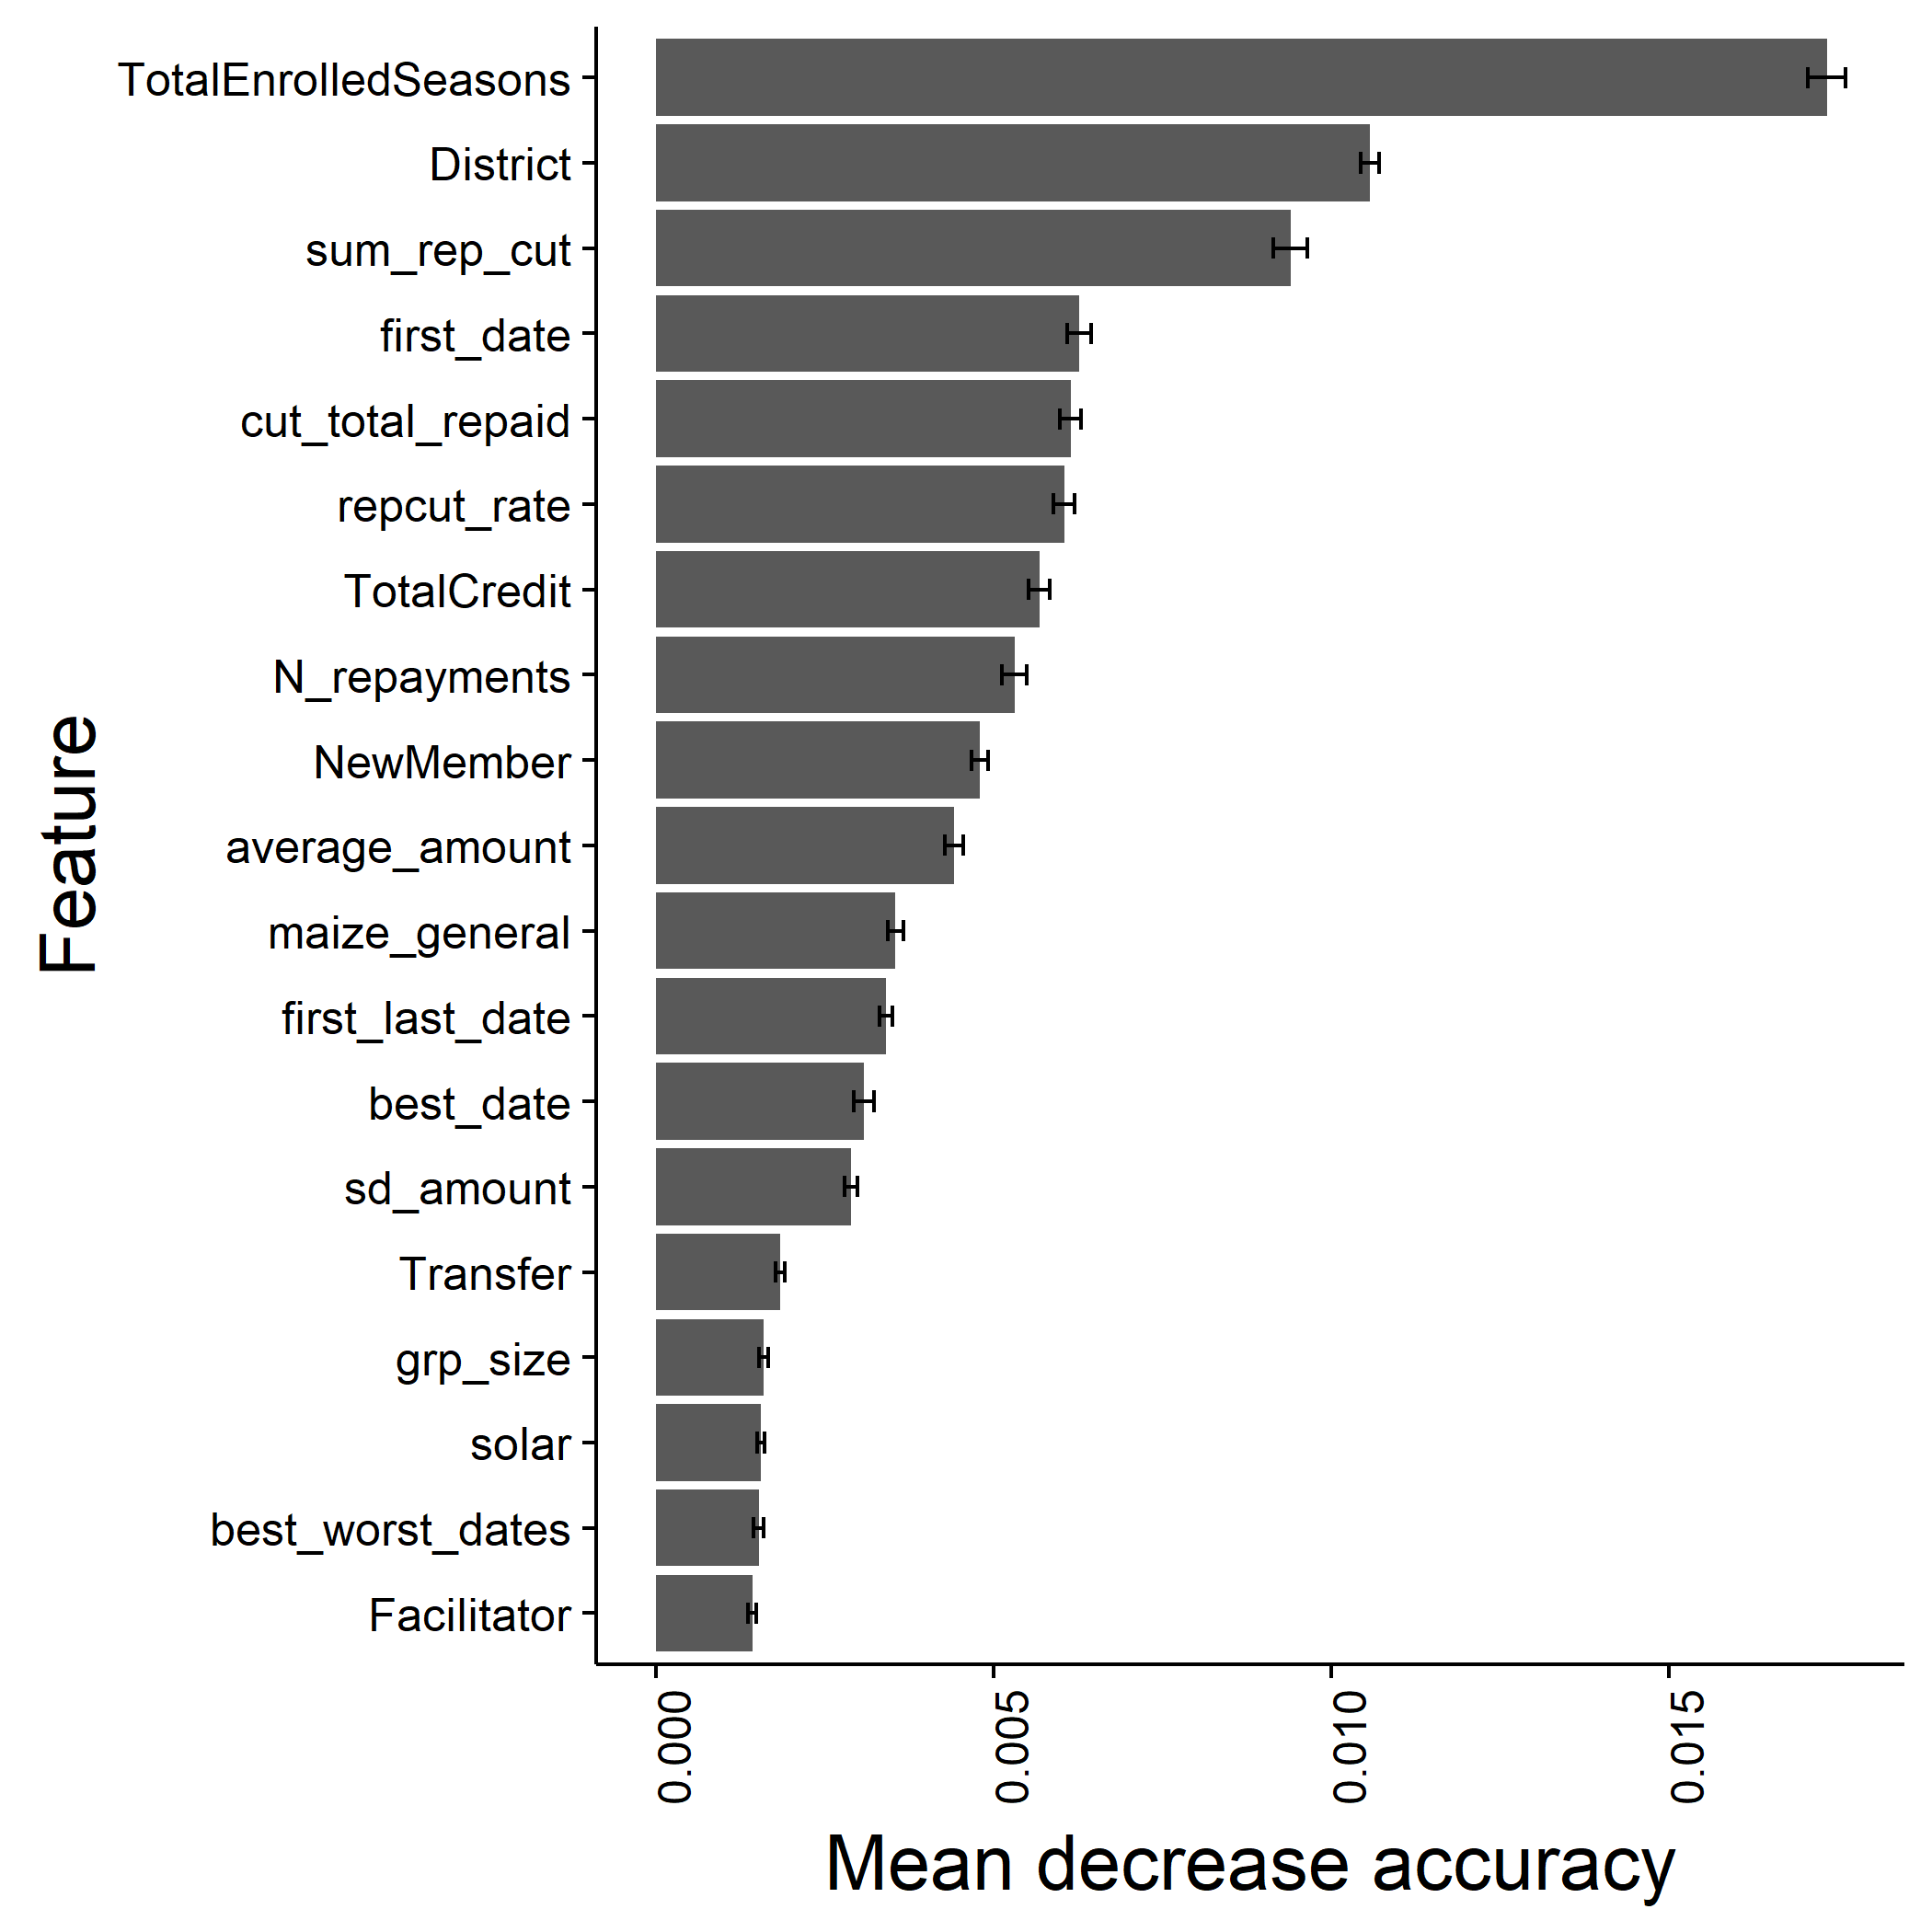
Finally, the training process generates informative plots such as the variable importance plot:
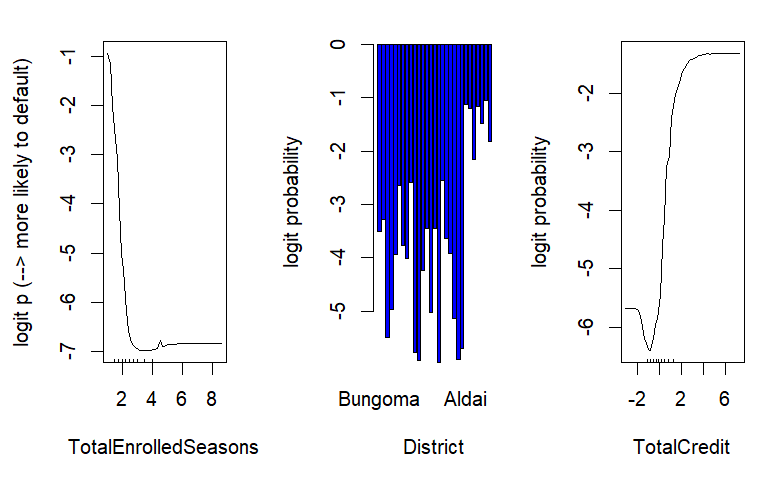
And some partial-dependency plots:
The last part of the process involves applying the model to cleaned data from the current year. These predictions are then shared with loan officers and call centre staff for follow up
- Loan officer fraud detection
- Individual level predictions
- Hybrid approach combining predictions of final % repaid with default probability
- Default hotspot mapping for decision making