This will launch a python plots and displays the battery status, solar cell production, and electricity grid consumption metrics for the last many days day.
Exports plot to .png and csv files (see pictures in this repo)
The data for this program is sourced from your XOLTA battery system. The data is collected almost real-time.
The following gauge shows the current battery status for the last 7 days:

The following line chart shows the solar cell production over the last 7 days:

The following line chart shows the electricity grid consumption over the last 7 days:

[api_credentials] username = password =
[api_xolta_id] device-id = site-id =
and point to this file in get_config.py
To find your device
- login your app.xolta.com
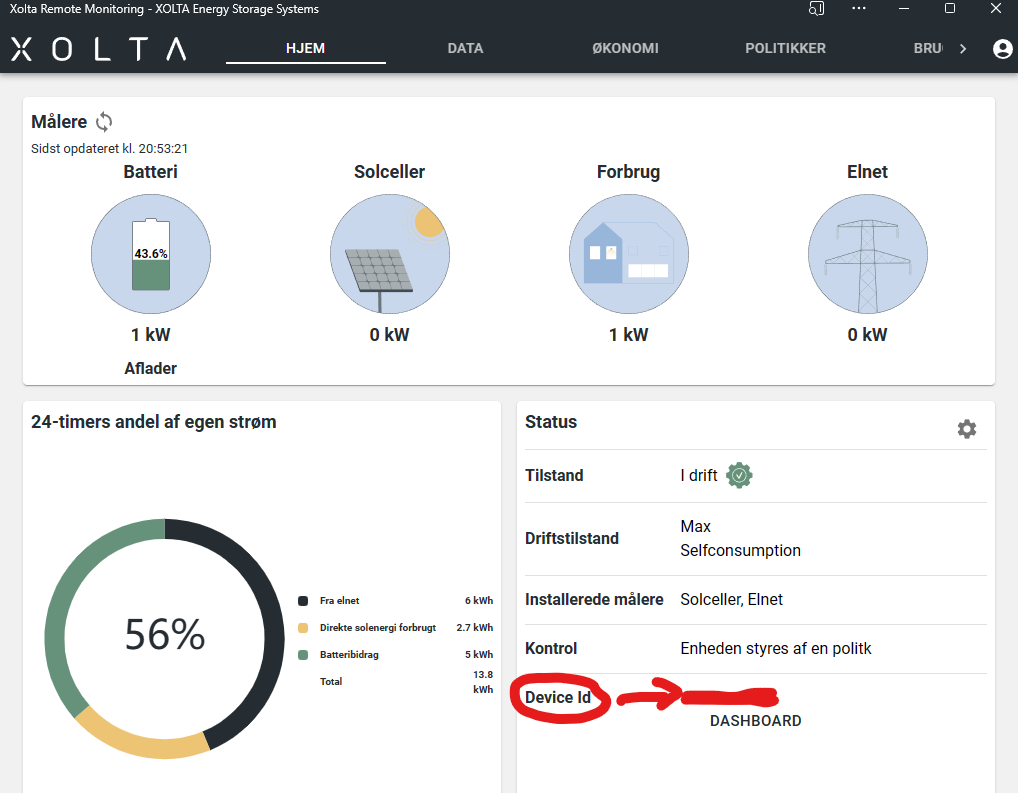
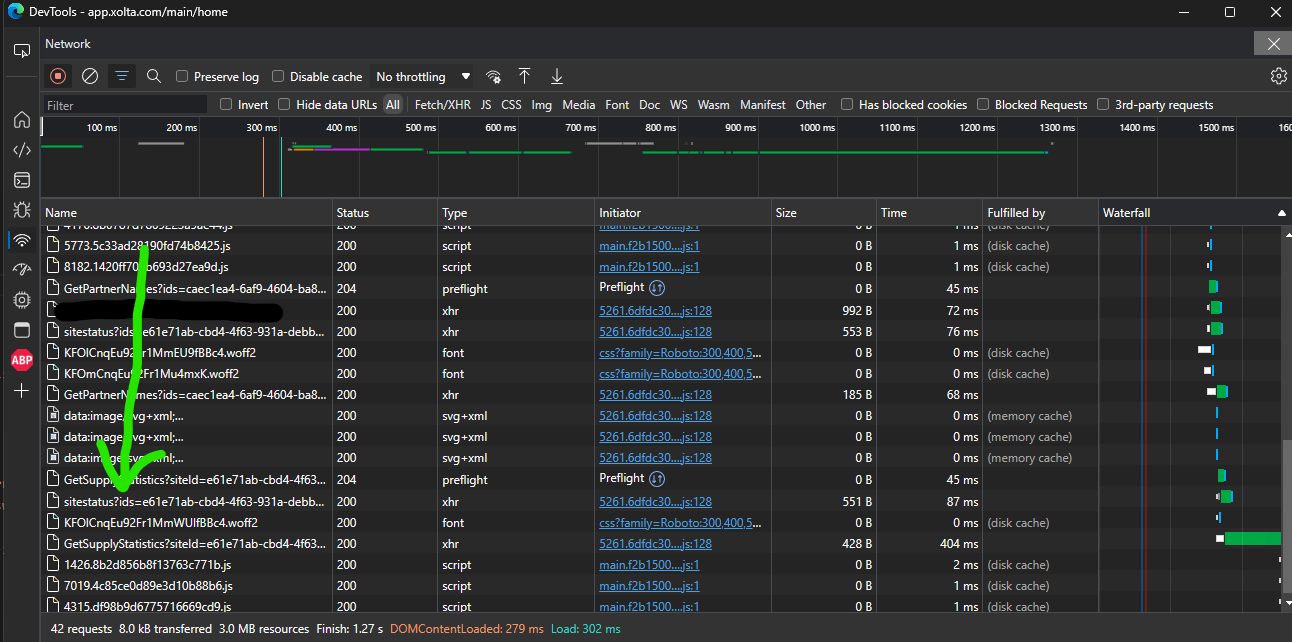
To find site-id open dev.tools and find the site-id here : (the device-id is also here)
api_data.py: This file contains the get_data() function that sends an API request to the Xolta server and returns the telemetry data.
bearerCache.py: This file caches the authentication token to avoid making unnecessary requests for new tokens. It also provides the get_auth_with_renewal() function to automatically refresh the token when it expires.
data_formatting.py: This file formats the telemetry data into a pandas DataFrame.
datapunkter.py: This file defines the telemetry fields used in the project.
get_config.py: This file reads API credentials and device/site IDs from a configuration file.
plot_data.py: This file contains the plot_data() function that uses Matplotlib to visualize the telemetry data.
stack_days_one_color.py: This is the main script that fetches the data, formats it, and plots it using the functions from the other files.
xolta_get_auth.py: This file provides the XoltaBattAuthenticator class, which handles the authentication process using Selenium WebDriver.
This project is licensed under the MIT License - see the LICENSE.md file for details.
- Thanks to https://github.com/AThomsen for making the get token stuff