The purpose of this project is to visually show the differences between the magnitudes of earthquakes all over the world for the last seven days.
To complete this project, use a URL for GeoJSON earthquake data from the USGS website and retrieve geographical coordinates and the magnitudes of earthquakes for the last seven days. Then add the data to a map.
Used the JavaScript and the D3.js library to retrieve the coordinates and magnitudes of the earthquakes from the GeoJSON data. With Leaflet library to plot the data on a Mapbox map through an API request and create interactivity for the earthquake data.
Now that you have an overview of the project plan, let see the geographical maps snapshot that created at the end of the project:

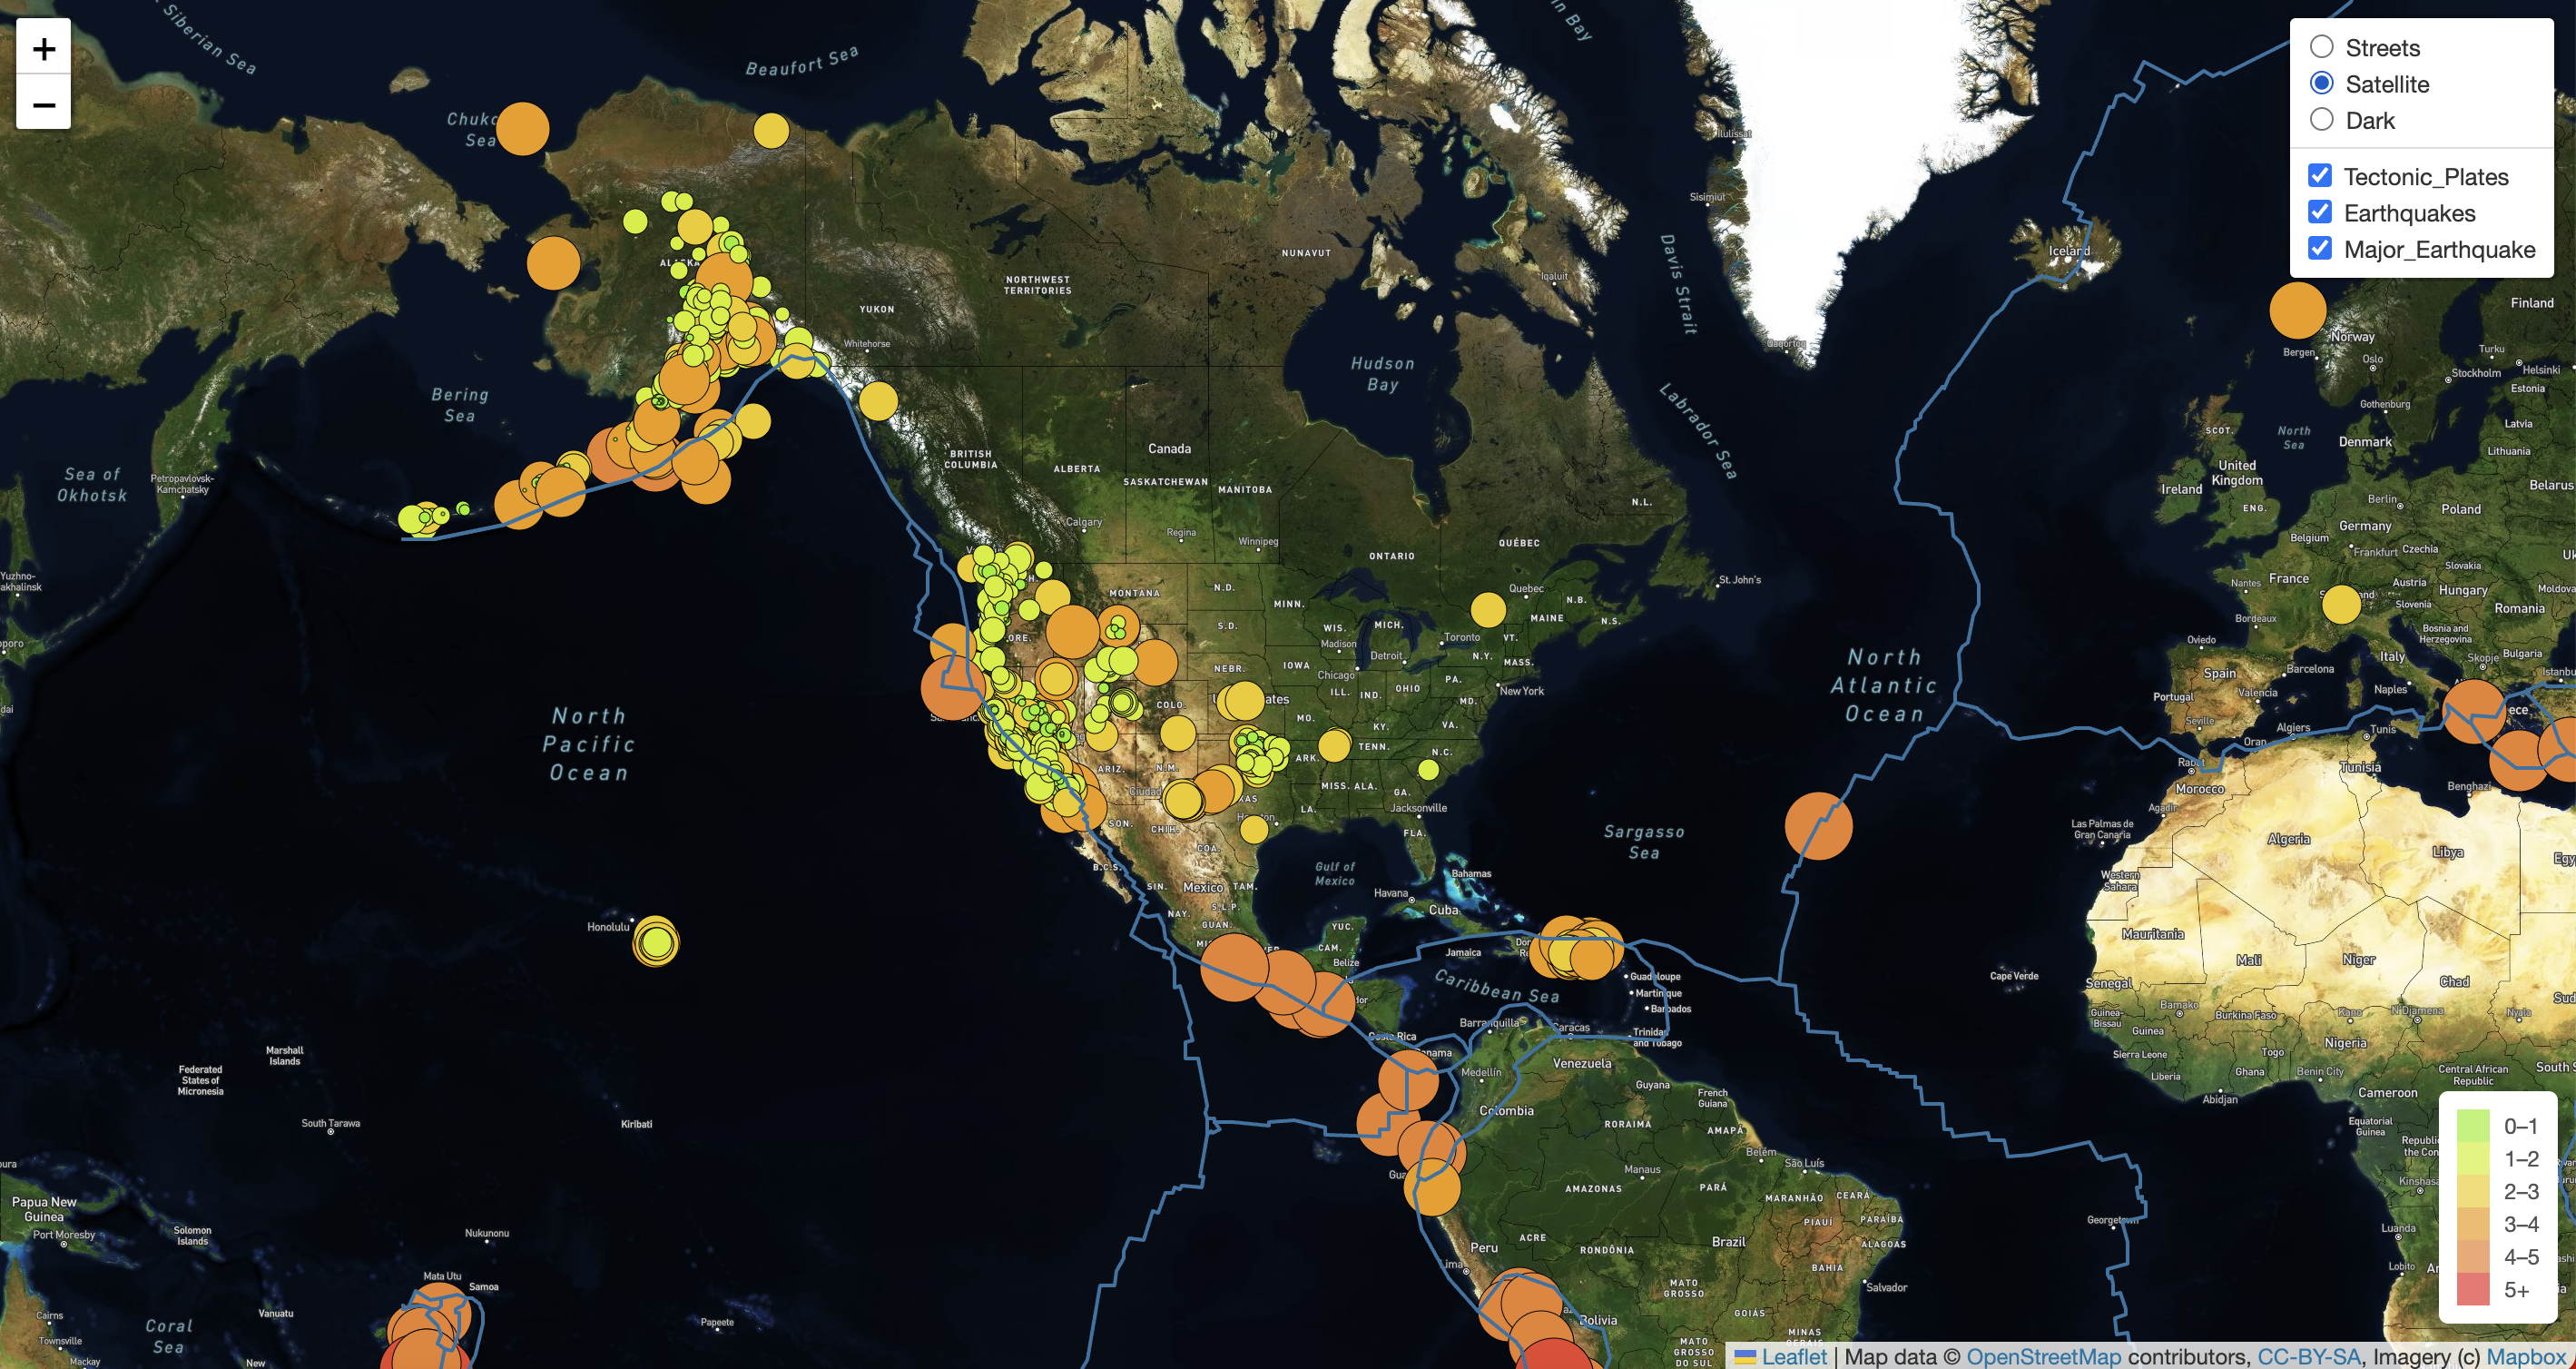
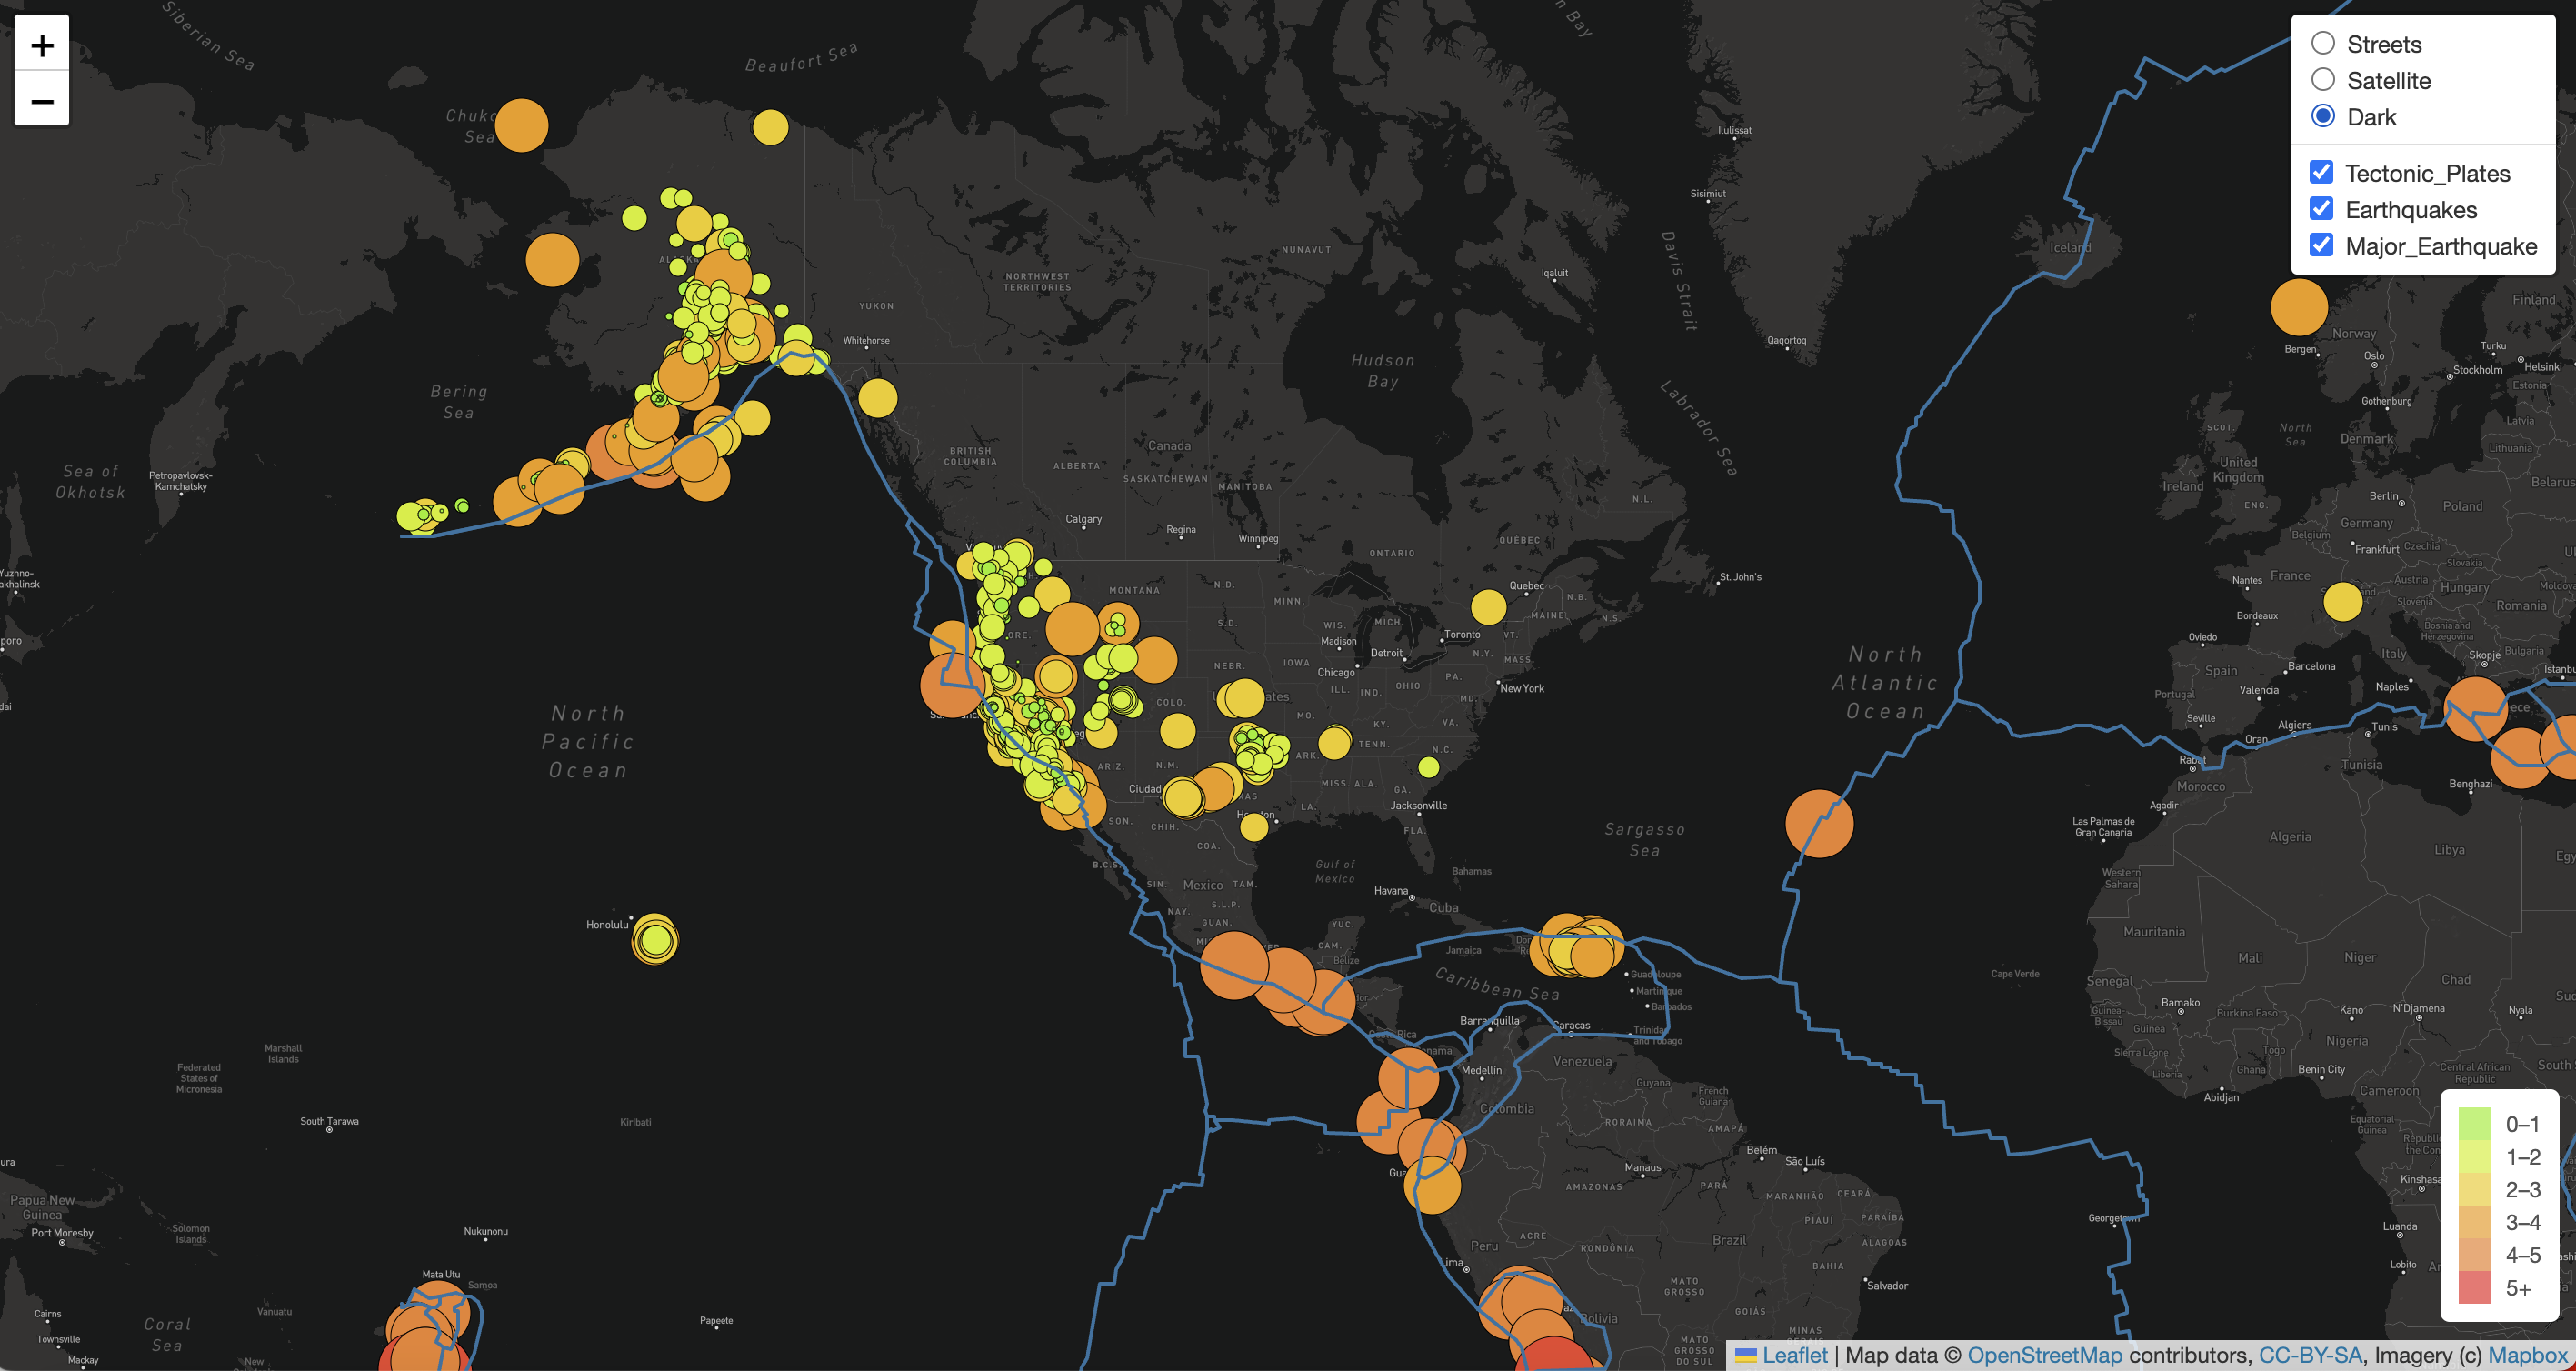
- mapbox map
- USGS geoJSON data for earthquakes in the last 7 days
Visual studio code, JavaScript, HTML, CSS, Leaflet, D3.js,