Investment to waves and ice cream based on the analysis on temperature data for the months of June and December in Oahu, Hawaii, in order to determine if the surf and ice cream shop business is sustainable year-round.
  1: Determine the Summary Statistics for June
  2: Determine the Summary Statistics for December
  3: A written report for the statistical analysis
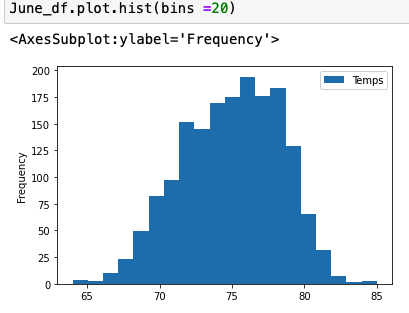
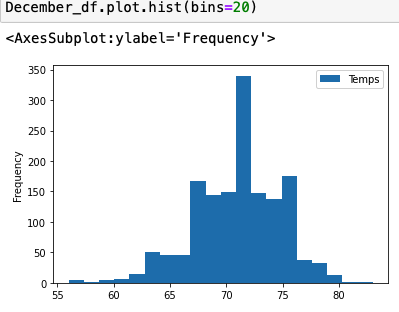
Summary statitics of Temperature and temp distribution for June and December, respectively, as follwoing pngs:

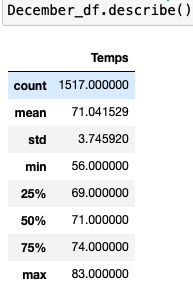
  1: Average temperature in June is 4F higher than December
  2: Minimum temperature in June is 9F higher than December
  3: Maximum temperature in July is only 2F higher than December,
     but when we look at the distribution of temp in July is belongs to normal distribution.
     Meaning that in July there is more days with higher temperature which beneficial for Surfs shop and ice cream shop.
I would confidently summarize that June gives good business to Surf and Ice cream shop than December in Oahu, Hawaii. However, based on the summary statistics count of measuremnet, in December is less than June about 180 times, in order to draw better conclusion about the December, i would do two more deeper analysis:
1: I would like to delve into the summary statistics of temperatures recorded by station for June and December to find thecomparable statition counts and do the analysis;
2: I would like to review other important variables that are correlated with optimal beach and surfing weathe such as precipitation;
Database resources: hawaii.sqlite Softwares: Python and SQLAlchemy