For this assignment, I have created a text file(cities.csv) stating 10 european countries with its characteristics. Source: https://www.wikipedia.org/
- Name
- Coordinates WGS 84 (EPSG:4326) (in decimal degrees)
- Area (in square km)
- Population
- Population Density (number per sqr km)
- GRP (in billion €)
- Avg Income per Month ( in €)
Then, an external data source containing the coastline of all the european nations. It's in geojson format.
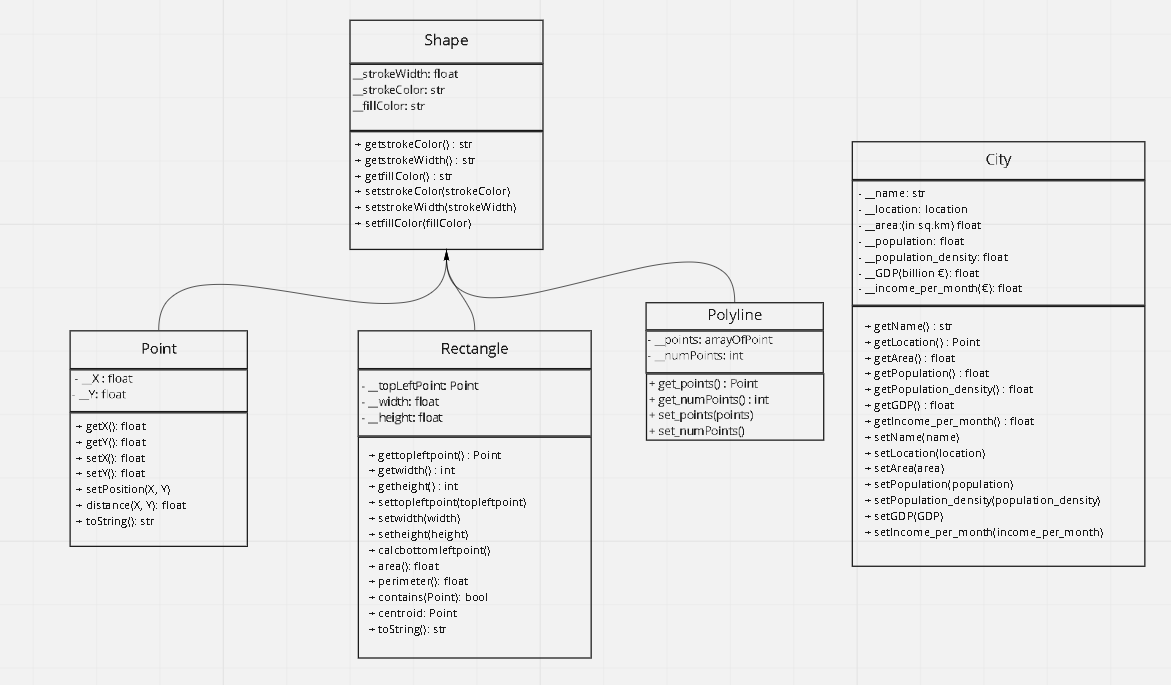
For representing each city in the file created an individual object. It has both getter and setter methods to work on.
It has both setter and getter methods as well as distance method to calculate the distance between two points.
It has both setter and getter methods and Contains method to check if the specified point is inside the specified rectangle. It also has methods to calculate area, perimeter, bottomleftpoint and, centroid of the rectangle.
It has setter and getter methods for the array/list of points and it calculates the len(points) on its own.
The shape class has been inherited by all the above classes except the City class. It has setter, getter methods for designing the shapes.
The cities.csv file can be read and converted into city object with location parameter to be a point class and the europe.geojson file can be read and converted to polyline class.
We are calculating the minimum bounding box for both the cities and the coastline file. It takes two parameters : data and the feature type of the data.
We know scale the data( cities and coastline). The specified scaling factor was used.
scale = 900/max(bounding_box_lines.getheight(), bounding_box_lines.getwidth())After scaling, translation is applied to both the data( The scaling factor of coastline was taken it doesn't hold any significant change but the presentation of the data improved)
xTranslation = 500 - bounding_box_lng
yTranslation = 500 - bounding_box_latFor visualisation, matplotlib has been used.
for city in cities:
    plt.scatter(city.getLocation().getX(), city.getLocation().getY(), c = city.getLocation().getfillColor())
    plt.text(city.getLocation().getX(), city.getLocation().getY(), city.getName(), c = "Black", size = 10)

for lines in c_lines:
    xArray = []
    yArray = []
    for coords in lines.get_points():
        xArray.append(coords.getX())
        yArray.append(coords.getY())
    plt.plot(xArray, yArray, c = lines.getstrokeColor())